
The manufacture of pharmaceutical products must be performed under controlled conditions. The production rooms of pharmaceutical facilities should have an appropriate design, which depends on the requirements of the products to be manufactured. Rooms, including walls, ceilings and floors, technical facilities like heating, ventilation, and air conditioning (HVAC), and equipment, including machinery and furniture, must be designed in such a way that defined environmental conditions for production can be met.
Constant environmental conditions are essential to guarantee a consistent quality of the manufactured products. Of course, this also applies to the staff working in these rooms. That is why the relevant directives require monitoring the environmental conditions and the personnel.
Under both non-sterile and aseptic manufacturing conditions, monitoring is the method of choice for detecting deviations from the qualified or validated status.
Monitoring is, therefore, an important part of proving that the manufacturing process is under control, and in aseptic production it plays a particularly important role.
Monitoring the environmental conditions in non-sterile production areas has also gained in relevance recently. It has become apparent that microbiological monitoring in these areas serves as a basis for necessary decisions and procedures, both in the analysis of deviations and in quality risk assessment.
There are relevant guidelines and regulations for microbiological monitoring in sterile and non-sterile production, and these are, in practice, supplemented by the definition of warning and action limits.
The following list shows some relevant guidelines and regulations for microbiological monitoring in sterile and non-sterile production areas:
- EU GMP guideline, Annex 1: Manufacture of Sterile Medicinal Products
- ISO 13408-1 Aseptic processing of health care products ISO 14644-1 Cleanrooms and associated controlled environments: Classification of air cleanliness by particle concentration
- ISO 14698-1 Cleanrooms and associated controlled environments: Biocontamination control
- FDA, Guidance for Industry: Sterile Drug Products Produced by Aseptic Processing - Current Good Manufacturing Practice • USP Chapter <1115> Bioburden Control of Nonsterile Drug Substances and Products
- USP Chapter <1116> Microbiological Control and Monitoring of Aseptic Processing Environments
- PDA Technical Report No. 67 - Exclusion of Objectionable Microorganisms from Nonsterile Pharmaceuticals, Medical Devices, and Cosmetics. 2014: Parenteral Drug Association, Inc.
- PDA Technical Report No. 13 (Revised) - Fundamentals of an Environmental Monitoring Program. Parenteral Drug Association, Inc., 2014
- ANVISA Quality Guide for Air Treatment and Environmental Monitoring Systems in the Pharmaceutical Industry (2013)
- PIC/S PE 009-13 Guide to Good Manufacturing Practice for Medicinal Products Annexes These guidelines also lay down the permitted limits, both for particles and for microbiological contamination
Action limit: as mentioned in the requirement, the regulatory limit can be used as an action limit, or alternatively, a statistically derived lower limit can be adopted; for example, at 99% percentile of the historical data. Obviously, an intensive investigation, including corrective and possibly preventive measures, is expected when exceeding an action limit.
Warning limit: If the warning limit is exceeded, an investigation should take place. This limit can be somewhat lower than when the action limit is exceeded. In this case, corrective and preventive measures may not be necessary.
The monitoring programme should, therefore, be set out in writing (i.e. a corresponding SOP should be available) and contain the following:
- Sampling points in sufficient detail
- Sampling frequencies that provide meaningful results
- Sampling time (e.g. during filling or at the end)
- Duration of sampling
- Sampling size (e.g. area of the imprint, air volume)
- Sampling equipment
- Sampling techniques
- Warning and action levels
- Corrective and preventive actions if warning and action levels are exceeded
Large amounts of data are also generated by the broad-based monitoring of air, surfaces and, if necessary, water, which in critical areas may even be carried out as permanent monitoring or with a high sampling frequency. Figure 1 shows an example of microbial counts recorded in six locations in a controlled room Grade C.
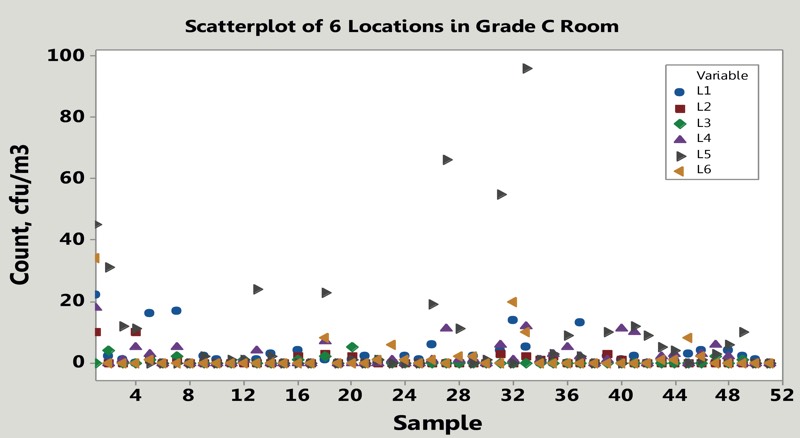
Figure 1: Example of microbial counts monitored weekly in six locations within a Grade C room
Dealing with “big data”
Today, the growing technology of rapid microbiological methods (RRM), aimed at real-time continuous monitoring of both microbes and particles in water and air, introduces an even higher level of data complexity. Instruments based on light-induced fluorescence (LIF) are capable of instantaneously detecting and counting particles and microorganisms in air or water samples every two seconds (R. Bar, Charting and evaluation of real-time continuous monitoring water bioburden, PDA J Pharm Sci Technol, in print, 2019). Thus, continuous monitoring leads to a vast amount of data recorded every day at a much larger volume than that obtained with traditional sampling commonly performed on a daily, weekly or monthly basis in controlled rooms.
The following example makes the case more evident: a single day of continuous monitoring at a rate of one point per two seconds generates about 43,200 data points, leading to a plot of a forest of crowded data that overshadow the underlying pattern of the monitoring process. The following process challenges the responsible person in quality. While conducting an ongoing risk analysis she/he has to carry out the following steps:
- Chart and analyse data
- Set action and alert limits
- Distinguish between statistically derived process performance limits and the regulatory action limits
- Interpret the overall monitoring process behaviour
- Detect a trend or shift in contamination levels
- Monitor excursion rates
Look again at Figure 1, which type of control chart would you draw? How would you set control limits? Would you average the data? Would you single out location 6?
A practical approach to data analysis
Rooms of Grade C and D, which are typically characterised with sizeable numbers of microbial counts, are amenable to standard control charting. Rooms graded B and A, which experience infrequent contamination, can also be monitored with contamination recovery rates as suggested in USP <1116>.
Figure 2 shows an example of a record of monthly and cumulative percentage of contamination recovery rates calculated from the microbial counts of passive air samples in a production room Grade B.
According to the recent revision of the EU Annex 1 (Dec. 2017), results from monitoring should be considered when reviewing batch documentation for finished product release. For this purpose, a good statistical but practical evaluation of the collected data is indispensable.
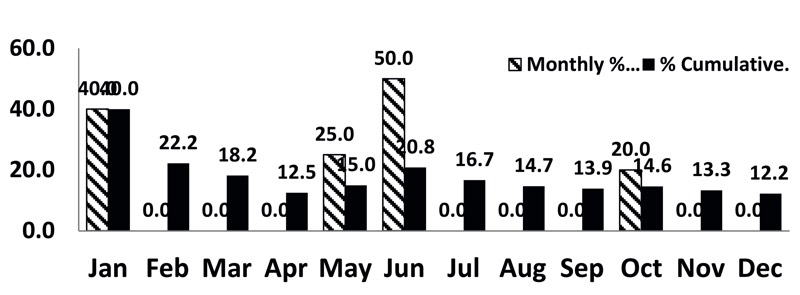
Figure 2: Monthly and cumulative percentage contamination recovery rates (per USP <1116>) calculated from the microbial counts of passive air samples recorded during one year in a room Grade B.
Does this conform with the USP <1116> suggested limit?
The application of the traditional Shewhart control charts is based on a fundamental assumption that the process data is statistically independent, and that the process operates with a constant mean. However, the data is not always independent, and additionally, may be auto-correlated. Therefore, data analysis should be conducted with a practical approach aimed at:
- Minimising false alarm signals
- Setting practical alert and action limits
- Revealing the monitoring process behaviour
- Evaluating whether the monitoring process is operating in an adequate state of control
In practice, the possibilities offered by optimal statistical data analysis are often not fully exploited. However, by optimising the handling of the results, the identification of trends and patterns in environmental data offer many opportunities to facilitate risk assessments, to improve processes and lead times in the laboratory, and to reduce sampling plans.
In this context, the Environmental Monitoring Data Management course by ECA Academy (20-21 November in Barcelona, Spain) will present the basic methodology of evaluating the data using elementary statistical process control tools as well as the empirical approaches to set microbial control limits for cleanrooms.
N.B. This article is featured in the October 2019 issue of Cleanroom Technology. Subscribe today and get your print copy!
The latest digital edition is available online.