The measurement of component cleanliness has largely been subjective, but Dr Leonard B Hazell and Dr Jean-Claude Canry, CERAM, have looked at methods of quantifying cleanliness, useful in the auditing of cleaning processes and components
When applied to surfaces the word "clean" is a non-specific term. This is because assessment is either subjective (i.e. visual) or relies on the detection and quantification of extractable particles and non-volatile residues. In this regard, the cleanliness of an artefact is implied by the absence of extractable material using a range of solvation methods. If the artefact is to be inserted into humans or used in a sensitive aerospace environment, for example, it is important to know what is not extractable rather than what is. The measurement of extractables says more about manufacturing practice than about actual surface cleanliness.
Machined or moulded materials are frequently contacted with some form of chemical agent or formulation acting as a coolant, lubricant or release agent. For many components, their subsequent application may be compromised by such residual surface contamination and thus parts are routinely cleaned in a bespoke process.
CERAM has been involved for many years in measuring the results of cleaning processes, in terms of the chemical composition of the residual species present, through its ‘Validata’ service. The information is used by clients to validate and compare cleaning processes in terms of their efficacy, and the data is often used in regulatory submissions.
Given the critical nature of the cleaning procedure on subsequent component functionality, CERAM has carried out trials to investigate the absolute levels of cleanliness achievable in such processes. A selection of relevant substrates and exceptional contamination removal techniques have been used to establish the ‘gold standard’ for cleanliness against which all other process outcomes can be compared.
Surface Adsorption and Surface Analysis: Surface analysis techniques, such as X-ray Photoelectron Spectroscopy, XPS (formerly ESCA) and Time-of-Flight Secondary Ion Mass Spectrometry (ToFSIMS), are ideally suited to defining the nature and amount of material that would be regarded as contamination on a surface.
There are logistical limitations to using imaging techniques, such as scanning electron microscopy (SEM), to search for small and sparsely scattered particulates but adsorbed organic material, such as drying stain residues, can easily be identified and quantified using XPS and ToFSIMS. The surface sensitivity of these techniques is important in that they sample only the outer several molecular or atomic layers of a material (3–10nm).
adbsorbed layers
Figure 1 shows the difference between an irregular-shaped particle with few attach-ment points, which could easily be removed by an aggressive mechanical clean such as ultrasonication in an eluent detergent solution or solvent, and the same amount of material adsorbed as a near monomolecular layer, which may have a vast number of bonding sites and be resistant to anything but chemical attack, which could damage the substrate or its native protective oxide.
By way of example, a single monolayer of stearic acid 2.4nm thick is equivalent to 225ngcm-2, which is more than 200 times greater than the limits of extractable material set for components of the proposed space mission to seek evidence of life on Mars. A 1µm diameter spherical particle of stearic acid could be spread over an area of 220µm2 as a mono-molecular layer.
While the surface of objects on Mars are subject to sputtering desorption due to dust storms and solar wind bombardment, the saline environment of human body fluids is a prime candidate for liberating the adsorbed compounds on implants over time through corrosion reactions, however mild.
It is this adsorbed material that is present on the surface of a device as it is inserted into the body that this article investigates.
Experimental: If a perfectly clean device is defined as one where the surface consists only of elements and compounds that are “expected” and wanted, then everything else detected on the surface can be defined as contamination. The main sources of residual contamination at the point of use are the final stage rinses after cleaning, the packaging and storage conditions and adsorption from the atmosphere. The latter sets a practical limit on the cleanliness of the device and, furthermore, on the measure-ment of the cleanliness by surface analysis techniques. To research this limit for a range of common materials CERAM has prepared hyperclean surfaces and evaluated the level of adsorption from the lab atmosphere where surface analysis was carried out.
Typical measurements of the gaseous composition of the atmosphere completely omit the volatile organic perfumes, plant fragrances, animal odours, exhaust fumes, pheromones, stenches etc. that the sense of smell detects. These vapours tend to be local in nature but they are also composed of highly functionalised molecules that readily attach to surfaces.
To obtain hyperclean surfaces three approaches have been used to remove adsorbed organic material as the main problem, and also inorganic material where possible.
Initially, oxygen plasma ashing has been used to burn off carbonaceous material in a “cool combustion” process in a vacuum chamber. A radio frequency (RF) excited plasma was used for approximately 20 mins in a quartz barrel reactor that produces excited oxygen molecules (rather than energetic oxygen ions). These react with organic compounds to decompose and remove them as carbon dioxide and water vapour.
This process oxidises the surface at the monolayer level and leaves behind non-volatile oxides. It terminates when carbonaceous species are no longer accessible and the outermost surface consists entirely of refractory oxides. This termination occurs because there is no significant sputtering in this process to disrupt the stable surface created.
A variation on this method involves the use of argon plasma, which introduces a degree of sputtering since there can be no chemical reactions. A mixture of the gases can be used to get the benefit of both processes but this has not been done in this particular study.
The ‘ultimate’ cleaning method is the use of argon ion bombardment (AIB) etching in ultra high vacuum (UHV) and this is the third method used in this work. This method implants argon but can remove all surface material, including the native surface oxide, leaving the surface in an extremely reactive state.
In all cases the samples must be exposed to the atmosphere at some stage prior to use and so this work has involved deliberately taking them into the lab atmosphere for a fixed period of time either wrapped in aluminium foil or left open but covered. Aluminium foil is an inherently clean and chemically pure material, which CERAM advises clients to use to store and transport samples for analysis to minimise the potential for sample contamination from packaging.
| Table 1: Surface compositions in At% derived from XPS survey spectra – Quartz | ||||||||
| Quartz | Ref. | Argon Plasma | O2-Plasma | AIB clean | AIB clean + air exposed | |||
| Element | as rec’d | Al foil | air | al foil | UHV 15 min | al foil | air | |
| Carbon | 5.9 | 2.0 | 2.4 | 2.1 | 1.9 | 5.6 | 6.8 | |
| σ | 0.3 | 0.2 | 0.3 | 0.3 | 0.3 | 0.3 | 0.3 | |
| C-C:C-H | 5.02 | 1.70 | 2.01 | 1.82 | 1.57 | 4.59 | 5.73 | |
| C-O | 0.62 | 0.19 | 0.27 | 0.20 | 0.17 | 0.78 | 0.76 | |
| C=O | 0.18 | 0.06 | 0.08 | 0.05 | 0.07 | 0.21 | 0.20 | |
| O-C=O | 0.07 | 0.04 | 0.08 | ND | 0.04 | 0.05 | 0.06 | |
| Oxygen | 62.6 | 64.4 | 64.0 | 64.6 | 61.4 | 60.0 | 59.5 | |
| σ | 0.2 | 0.2 | 0.3 | 0.3 | 0.3 | 0.3 | 0.3 | |
| Silicon | 31.6 | 33.0 | 32.1 | 31.4 | 34.6 | 32.3 | 31.6 | |
| σ | 0.2 | 0.2 | 0.2 | 0.2 | 0.2 | 0.2 | 0.2 | |
| Fluorine | ND | 0.63 | 1.5 | 1.9 | ND | ND | ND | |
| σ | 0.09 | 0.2 | 0.2 | |||||
| Argon | ND | ND | ND | ND | 0.69 | 0.8 | 0.62 | |
| σ | 0.09 | 0.1 | 0.08 | |||||
| Nitrogen | ND | ND | ND | ND | 1.5 | 1.3 | 1.5 | |
| σ | 0.2 | 0.1 | 0.2 | |||||
| Total | ND | ND | ND | ND | ND | ND | ND | |
| σ | ||||||||
| O balance | 64.0 | 66.4 | 64.6 | 63.1 | 69.5 | 65.7 | 64.3 | |
| O actual | 62.6 | 64.4 | 64.0 | 64.6 | 61.4 | 60.0 | 59.5 | |
| O:Si ratio | 2.0 | 1.9 | 2.0 | 2.1 | 1.8 | 1.9 | 1.9 | |
| Σ quartz | 94.7 | 99.1 | 96.2 | 94.3 | 103.8 | 97.0 | 94.9 | |
| Σ contam. | 6.76 | 2.91 | 4.40 | 4.21 | 4.32 | 8.68 | 9.91 | |
| CI | 0.93 | 0.97 | 0.96 | 0.96 | 0.96 | 0.92 | 0.91 | |
The results: The composition data in Table 1 for silicon dioxide in the form of quartz show that this oxide is relatively resistant to the adsorption of organic material from the atmosphere. The “as received” sample coupon has only 5.9At% carbon on the surface in total. This is reduced further by argon or oxygen plasma cleaning to approximately 2.0At%, which is one of the lowest levels CERAM has ever measured on an air-exposed sample. Note that storage in aluminium foil has a beneficial effect in keeping down the level of adsorption from the atmosphere.
Argon ion bombardment (AIB) cleaning in ultra high vacuum is unreliable on insulating samples due to charge build-up on the surface that deflects the ion beam. In this situation, the AIB clean produces a surface in UHV that has as much carbonaceous material adsorbed from the UHV chamber as is adsorbed from the atmosphere after the plasma cleaning. The fluorine from the plasma treatment is removed and argon and some nitrogen (from flushing the argon supply) are implanted. The sample is left slightly oxygen deficient due to preferential sputtering and this probably increases its susceptibility to adsorption from the atmosphere when exposed for a short period. Again, though, there is a benefit in wrapping the sample loosely in aluminium foil to prevent access of contaminants.
Table 1 includes the CERAM Cleanliness Index (CI), which is a number devised to incorporate the entire composition of a sample into a single parameter for easy comparison between samples. In its simplest form it is given by the sum of the compositions of species that are designated as expected to be present as a fraction of the total:
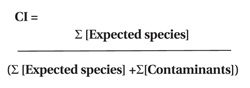
Since XPS data is normalised, the denominator in the above equation should ideally equal 100 and this gives a CI parameter between 0 and 1 where 1 represents a perfectly clean sample and 0 a sample where none of the expected species is detectable beneath a surface layer of contaminants.
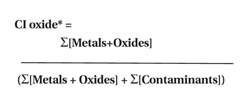
For metal substrates the expected species usually include the surface oxides, and this means that calculation of the total expected species is not straightforward. Due to the many and varied forms of oxygen that can be distinguished in XPS the denominator may not sum exactly to 100. To allow for this CERAM has developed methods using least squares optimisation calculations and measuring the levels of expected species (including surface oxides) and the contamination separately then renormalising.
For quartz, values of the CI greater than 0.95 are obtainable, and maintainable, using plasma cleaning. In contrast to quartz, the composition data in Table 2 show the results of treating CoCrMo alloy coupons in oxygen and argon plasma and storing the samples for one hour in aluminium foil or in the open lab before inserting them into the spectrometer for XPS analysis.
The plasma cleaning may remove all trace of organic material from the surface but exposure to the atmosphere prior to analysis enables adsorption of 11–18At% carbon due to the greater reactivity of the clean alloy relative to quartz. The traces of sulfur, calcium and silicon are treated as contamination, although silicon is also a minor component of the alloy.
The surfaces have a variety of native oxides that are very thin or patchy because the metallic components can be detected within the 5–8nm sampling depth of XPS.
AIB cleaning in UHV removes most of these oxides, implanting argon and leaving the surface rich in carbides and highly reactive, such that it adsorbs organic species from the vacuum system over a 60-minute period. The exposure of the freshly cleaned samples to air causes the oxides to re-grow, as expected, and the adsorption of organic species occurs, presumably to a saturation level similar to that for the plasma cleaned samples.
| Table 2: Surface compositions in At% derived from XPS survey spectra - CoCrMo alloy | ||||||||
| O2-plasma | Ar-plasma | AIB clean | Air exposed | |||||
| Element | Al foil | air | Al foil | air | 0 min | 60 min | Al foil | air |
| Carbon | 16.1 | 17.6 | 11.6 | 13.6 | 12.4 | 23.2 | 19.9 | 23.7 |
| σ | 0.5 | 0.4 | 0.5 | 0.5 | 0.6 | 0.6 | 0.6 | 0.7 |
| Carbide | ND | ND | ND | ND | 4.8 | 7.9 | 3.0 | 3.7 |
| C-C | 12.5 | 13.5 | 9.1 | 10.1 | 6.2 | 13.0 | 10.0 | 12.9 |
| C-O-C/C-OH | 2.2 | 2.5 | 1.5 | 2.1 | 1.1 | 1.9 | 1.7 | 1.6 |
| C=O | 0.7 | 0.8 | 0.4 | 0.5 | 0.3 | 0.3 | ND | ND |
| O-C=O | 0.8 | 0.8 | 0.6 | 0.9 | ND | ND | 5.2 | 5.5 |
| Organic C | 16.1 | 17.6 | 11.6 | 13.6 | 2.9 | 7.3 | 14.0 | 16.3 |
| Oxygen | 56.0 | 55.0 | 57.5 | 55.4 | 5.9 | 7.1 | 38.6 | 34.0 |
| σ | 0.4 | 0.4 | 0.4 | 0.4 | 0.3 | 0.3 | 0.4 | 0.4 |
| Oxide | 36.6 | 34.3 | 18.5 | 20.6 | 2.3 | 2.6 | 11.0 | 10.2 |
| OH | 17.6 | 19.2 | 36.8 | 31.8 | 3.0 | 3.8 | 26.2 | 23.0 |
| O-C | 1.7 | 1.5 | 2.2 | 3.0 | 0.6 | 0.6 | 1.4 | 0.9 |
| Chromium | 5.3 | 4.9 | 6.6 | 6.3 | 20.2 | 17.2 | 10.1 | 10.3 |
| σσ | 0.1 | 0.1 | 0.1 | 0.1 | 0.2 | 0.2 | 0.2 | 0.2 |
| Cr metal | 1.3 | 1.3 | 0.2 | 0.1 | 20.2 | 17.2 | 4.6 | 5.5 |
| Cr ox | 4.0 | 3.6 | 4.9 | 4.8 | ND | ND | 5.6 | 4.8 |
| Cr(VI) | ND | ND | 1.4 | 1.5 | ND | ND | ND | ND |
| Cobalt | 18.1 | 17.7 | 16.4 | 15.2 | 49.7 | 42.6 | 24.4 | 25.3 |
| σσ | 0.2 | 0.2 | 0.2 | 0.2 | 0.5 | 0.4 | 0.3 | 0.3 |
| Co metal | ND | ND | ND | ND | 47.7 | 40.9 | 10.4 | 12.2 |
| Co(II) | 10.8 | 9.3 | 11.5 | 9.9 | ND | ND | ND | ND |
| Co(III) | 7.4 | 8.4 | 4.9 | 5.3 | 2.0 | 1.7 | ND | ND |
| Co ox | ND | ND | ND | ND | ND | ND | 11.9 | 11.7 |
| Co sat | ND | ND | ND | ND | ND | ND | 2.2 | 1.4 |
| Molybdenum | 1.11 | 0.99 | 1.25 | 1.36 | 7.1 | 5.9 | 3.75 | 3.8 |
| σ | 0.07 | 0.08 | 0.07 | 0.07 | 0.2 | 0.2 | 0.09 | 0.1 |
| Mo metal | 0.11 | 0.07 | 0.15 | 0.18 | 7.06 | 5.93 | 1.86 | 2.05 |
| Mo(IV) | 0.05 | 0.04 | 0.19 | 0.2 | ND | ND | 1.16 | 1.16 |
| Mo(VI) | 0.95 | 0.88 | 0.9 | 0.98 | ND | ND | 0.73 | 0.58 |
| Silicon | 1.7 | 2.2 | 2.8 | 2.6 | 1.0 | 0.8 | 0.5 | 0.4 |
| σ | 0.3 | 0.4 | 0.3 | 0.4 | 0.4 | 0.3 | 0.3 | 0.2 |
| Calcium | 0.07 | 0.30 | ND | 0.54 | ND | ND | ND | ND |
| σ | 0.07 | 0.09 | 0.09 | |||||
| Fluorine | 1.1 | 1.0 | 2.2 | 3.5 | ND | ND | ND | ND |
| σ | 0.2 | 0.2 | 0.2 | 0.2 | ||||
| Sulfur | 0.5 | 0.4 | 1.7 | 1.6 | ND | ND | ND | ND |
| σ | 0.2 | 0.1 | 0.2 | 0.2 | ||||
| Argon | ND | ND | ND | ND | 3.8 | 3.3 | 2.0 | 1.9 |
| σ | 0.3 | 0.2 | 0.2 | 0.2 | ||||
| Nitrogen | ND | ND | ND | ND | ND | ND | 0.7 | 0.6 |
| σ | 0.2 | 0.2 | ||||||
| CI metal | 0.02 | 0.02 | 0.01 | 0.01 | 0.80 | 0.72 | 0.20 | 0.24 |
| CI oxide* | 0.62 | 0.61 | 0.63 | 0.60 | 0.87 | 0.78 | 0.77 | 0.75 |
Table 2 includes the very low CI values calculated assuming a metallic surface is the only acceptable condition and also, more realistically, gives CI oxide* values ~0.6 when allowing the oxides to be included but without the fluorine.
The work on CoCrMo alloys has been extended to the use of witness coupons, which have been through industrial medical device cleaning lines in order to audit and improve the efficiency of the processes. A further development was the use of a hip joint prosthesis that had been pre-cut to provide snap-off sample coupons for XPS analysis after passage through the full cleaning cycle alongside the witness coupons. This was done to ensure that the witness coupon approach gave equivalent results to the real components as part of CERAM’s ‘Validata’ initiative to measure the cleanliness of other prosthetic materials, including stainless steel and titanium.
The results obtained, and a realistic assessment of the possible sources of the adsorbed organic contamination, indicated that the surface of the final water rinse bath through which the cleaned samples have to pass before drying is a potential source of surface active residues.
To verify this, a coupon of polypropylene was floated on the surface of an aqueous solution of a common household washing- up liquid known to contain a sulfonate based anionic detergent. The concentration of this active component of the detergent in the bulk of HPLC grade water was ~1ppm v/v. This level does not form foam and is considered likely to arise in an industrial cleaning line prior to completely replacing the rinse water.
The ToFSIMS spectra in Figure 2 offer a comparison of the surface of the coupon with an unexposed piece of the same material (which contains a number of additives at low levels). It shows that this technique is capable of detecting the presence of the detergent additive extracted from the surface of the liquid. This approach can be used routinely to audit a cleaning line and to identify potential contaminants on the surface of cleaned components.
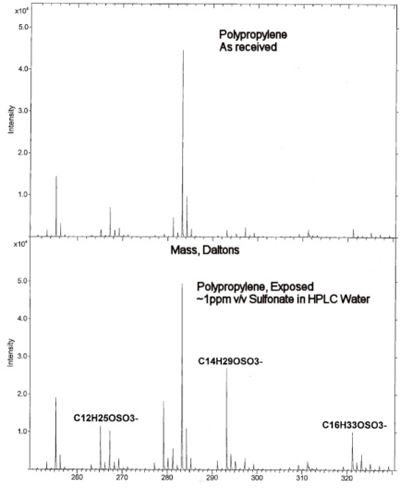
Fig. 2: ToFSIMS spectra showing the detection of detergent residues arising from the surface of a cleaning process final rinse bath water
In conclusion, the results of this work show that the adsorption of organic matter from the atmosphere has a major impact on the surface chemistry of cleaned components. This is true even for items held under high vacuum. This makes it particularly important that the nature of such adsorbates is known in order to assess their potential impact on the subsequent functionality of the article in its intended use environment.
Adsorbed materials could be particularly detrimental to coating adhesion on a substrate or to the electrical properties of a multi-layer semiconductor component. Some toxicity may be exhibited if leached into their in vivo environment. The application of surface analytical techniques such as those referenced in this article can be particularly useful in identifying these adsorbed species. Moreover, this work sets ultimate cleanliness achievement standards for processes aimed at removing surface contaminants.