Many products and processes can be harmed by particles larger than 5 µm (macroparticles). For those with large vulnerable functional surfaces, the contamination by macroparticles needs to be limited and controlled. Macroparticles also carry a large proportion of the microorganisms in the air.
The ISO 14644-1 and 2 offer methods of specifying, classifying and monitoring air cleanliness for particles larger than or equal to (≥) 0.1 up to 5 µm. There are generally far more particles between 0.1 µm than above 5 µm, hence these small proportions are hard to measure by taking air samples.
Particle deposition rate measurement is an indirect way of monitoring the air cleanliness for particles larger than 5 µm, but it is a direct way of monitoring the likelihood of contamination of critical surfaces. Methods of measuring particle deposition rate are described in ISO 14644-3.
New ISO chapter
A new standard in the works by the ISO Technical Committee 209 Working Group 14 (TC209 WG 14), is set to offer methods to specify, verify and monitor the air cleanliness for particles larger than 5 µm in the air.
The standard, to be known as ISO 14644-17, focuses on particle deposition applications, and covers the missing information in existing documents.
The standard, to be known as ISO 14644-17, focuses on particle deposition applications, and covers the missing information in existing documents
This new chapter could be applied in many industries such as assembly of microelectronic like sensors and actuator, displays and batteries, optical devices, space industry, automotive, medical devices, and in processes dealing with microbiological contamination.
The new document can be used as a standard in combination with the existing cleanroom standards (ISO 14644 and ISO 14698), and completes coverage of the range of particles that can cause unwanted surface contamination.
Air cleanliness
Air cleanliness is expressed in the cumulative concentration of airborne particles per cubic metre of air. In an air sample, the number of particles and their size can be measured with a light-scattering airborne particle counter (LSAPC). The results can be used for cleanroom classification as long as a statistically reliable number of particles is counted.
The ISO 14644-1 states that air cleanliness classes of ISO 5 and cleaner cannot be determined for particles ≥ 5 µm. The number of particles decreases with size and therefore the LSAPC cannot provide representative data of large particles or cleaner air. It can still be used for monitoring, albeit with larger particles the sample is often too small, so the likelihood that particles get trapped and cannot be measured with the apparatus increases.
This article provides examples with data taken from a year of monitoring 24/7 the air cleanliness at various locations with a 100 litres/min LSAPC in a three-metre-high cleanroom with 20 air changes per hour (ACH). The cleanroom is used for the measurement and assembly of micromechanical devices, which fail when contaminated with particles ≥ 10 µm.
Measurement and assembly of micromechanical devices fail when contaminated with particles ≥ 10 µm
In the "at rest" occupancy state, the cumulative concentration of particles ≥ d µm –the relative particle diameters measured by LSAPC– is proportional to the square of the particle size (d2). Here, d is the lower equivalent diameter of the particle size bin of the particle counter. This means that particle size distribution aligns with the particle size distribution calculated from the ISO 14644-1 tables. The concentration of particles ≥ 0.5 µm is always smaller than 3,000 particles/cubic metre.
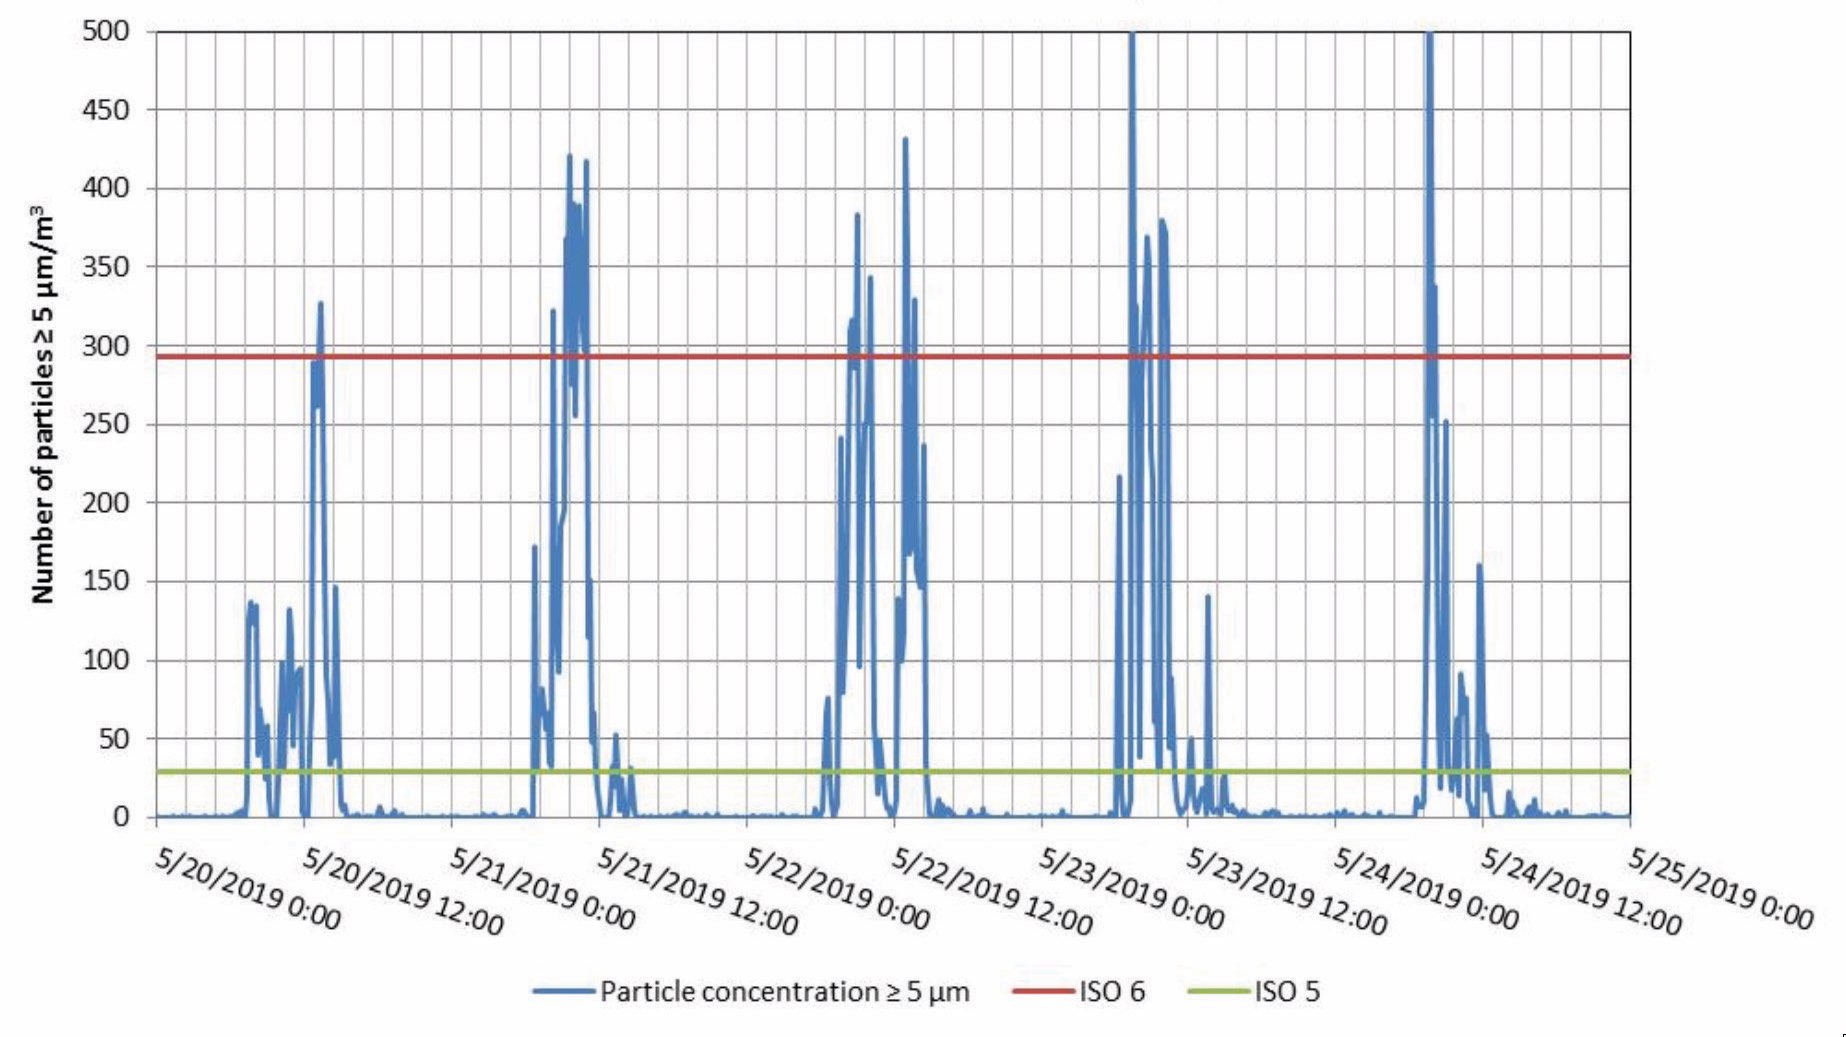
When staff works at various locations in the cleanroom, the number of airborne particles, including macroparticles, increases. When monitoring, it can be seen that the particle concentration varies with the activities of the people in the cleanroom. An example of the concentration of particles ≥ 5 µm per cubic metre is shown in figure 1 compared to the ISO standard concentrations.
Continuous measurement of airborne particle concentration
The increase of the average airborne particle concentration depends on the room size, the clean air supply rate and the number of people in the room. Furthermore, 24/7 monitoring data in the operational cleanroom demonstrated that the cumulative concentration of particles ≥ d µm is proportional to the particle size d. This phenomenon is shown in figure 2. In this case, the concentration of particles ≥ 5 µm per cubic metre is used to determine the ISO classes. It is observed that the concentration of macroparticles increases relatively more than the concentration of smaller airborne particles.
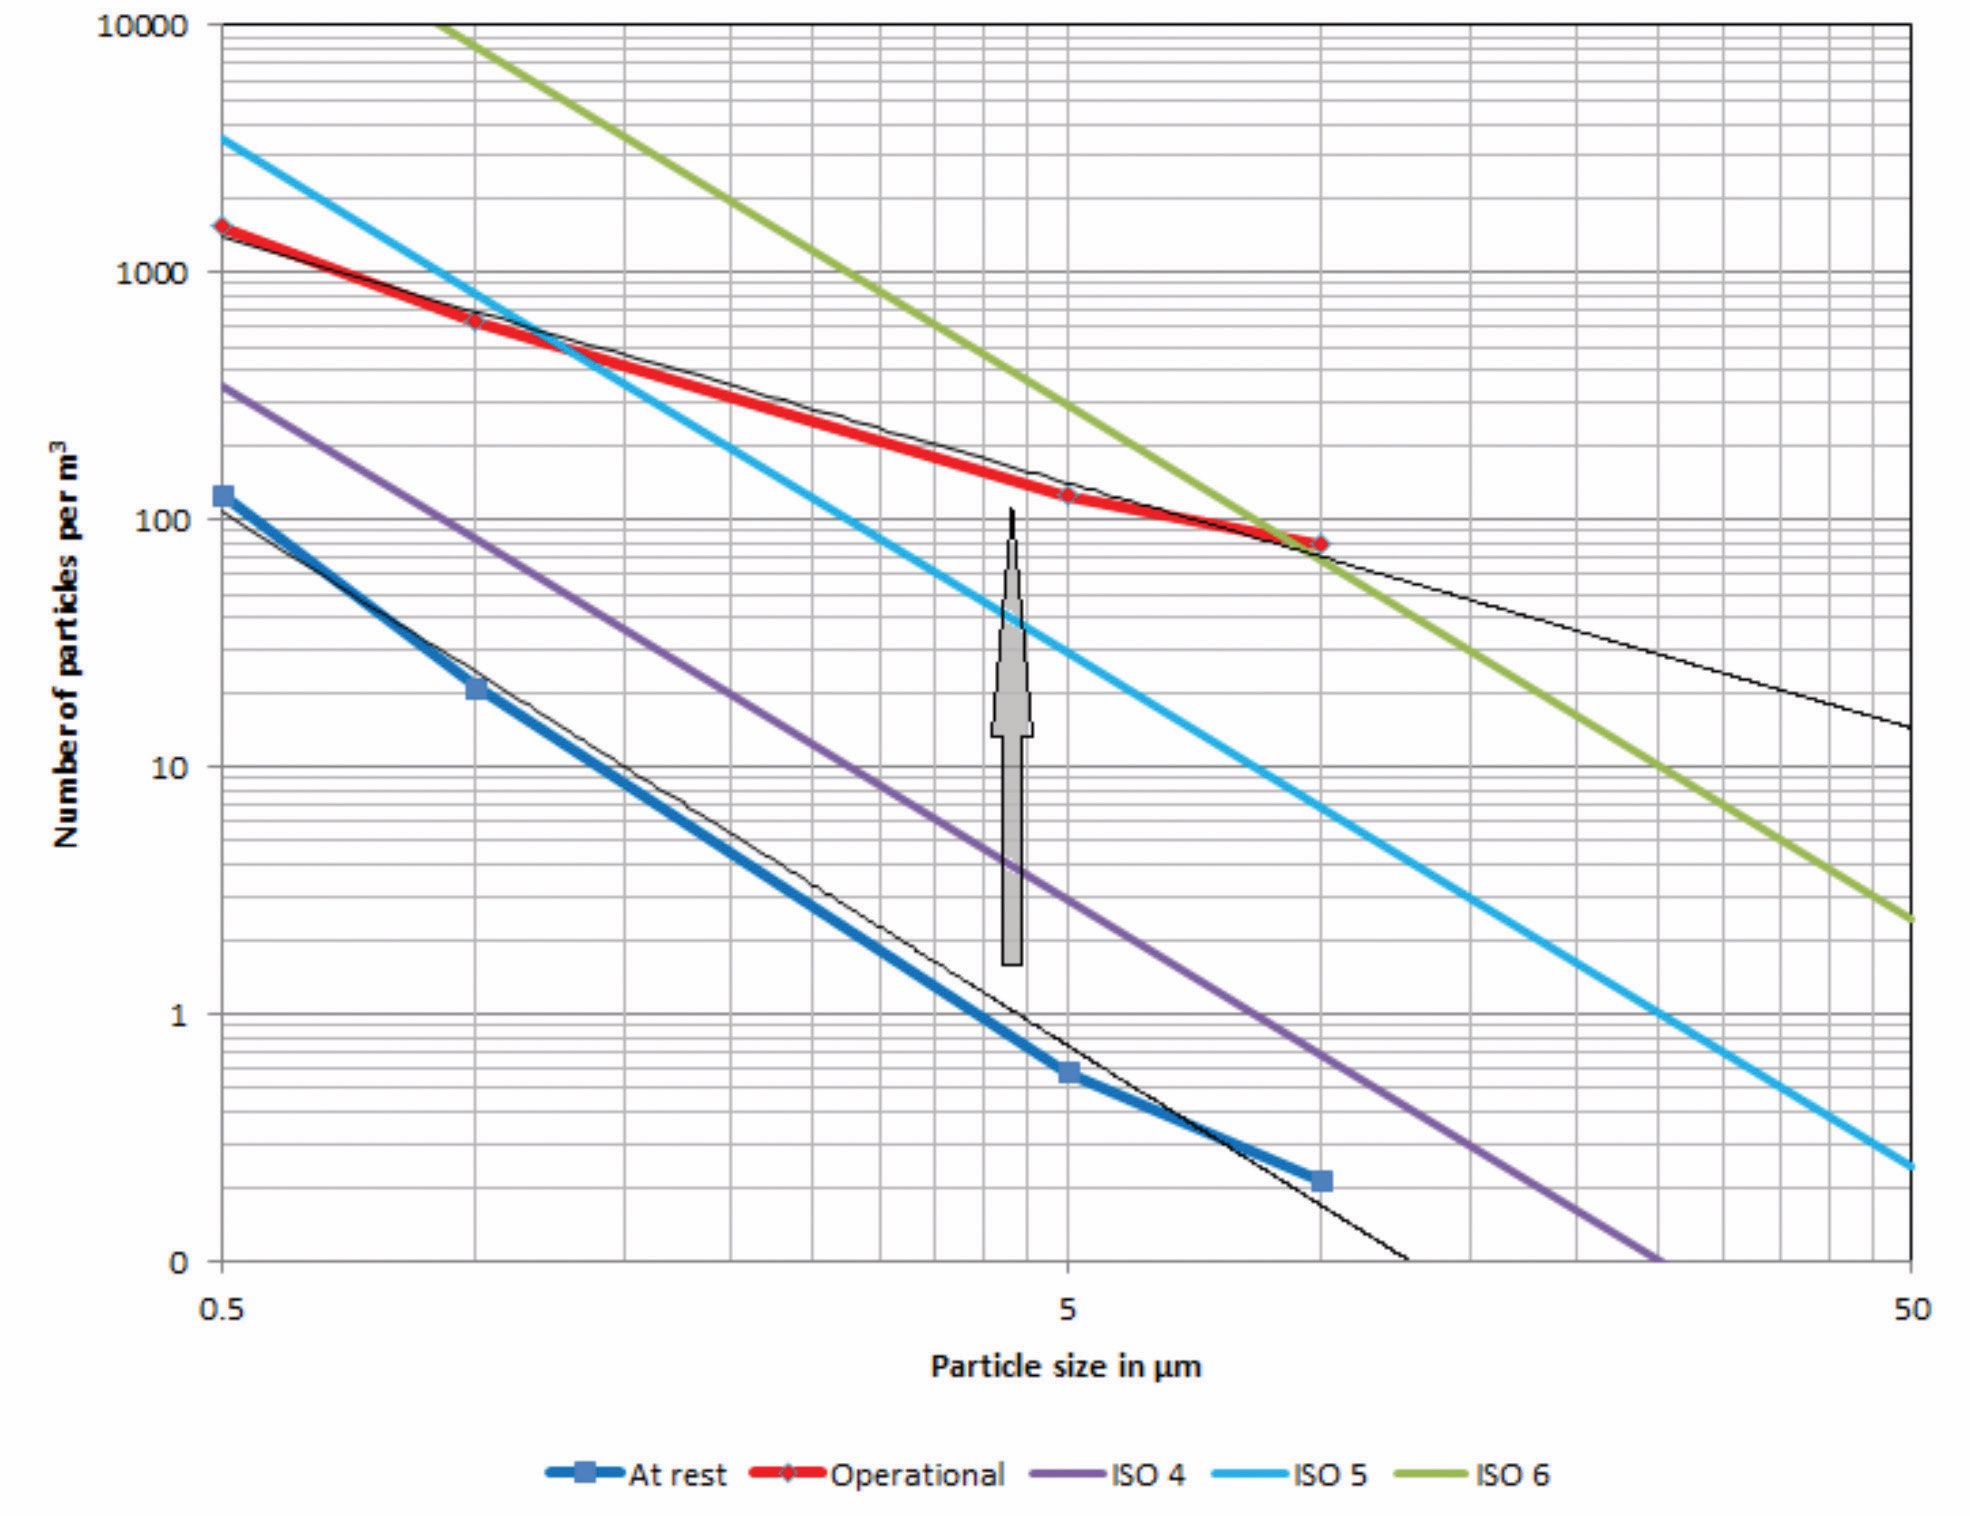
Average particle size distribution in at rest and operational cleanroom
When looking at particle emission data of a person in cleanroom garments it can be seen that the number of emitted particles is proportional to the particle size. Therefore, in a cleanroom with people, this change of distribution is observed.
Parallel to the monitoring of the airborne particle concentration, the particle deposition rate of particles larger than 15 µm is measured with an APMON real-time particle deposition monitor.
Particle deposition rate
Macroparticles deposit by a combination of sedimentation and impaction. The particle deposition rate (PDR) is expressed as the number of particles deposited on a square metre surface area per hour (N/m2/hr). This number is determined by the airborne particle concentration (C) and the deposition velocity (u), which is expressed as PDR = C.u.
This relation depends on the particle size. The impact of this relationship was investigated in a 2015 study. Following a series of experiments and calculations, the analysis showed that by combining the cumulative particle deposition velocity with the measured particle size distribution and concentration, the expected particle deposition rate during operation can be calculated (see figure 3). In the "at rest" state, the concentration is about 100 times lower, and no particle deposition rate is found.
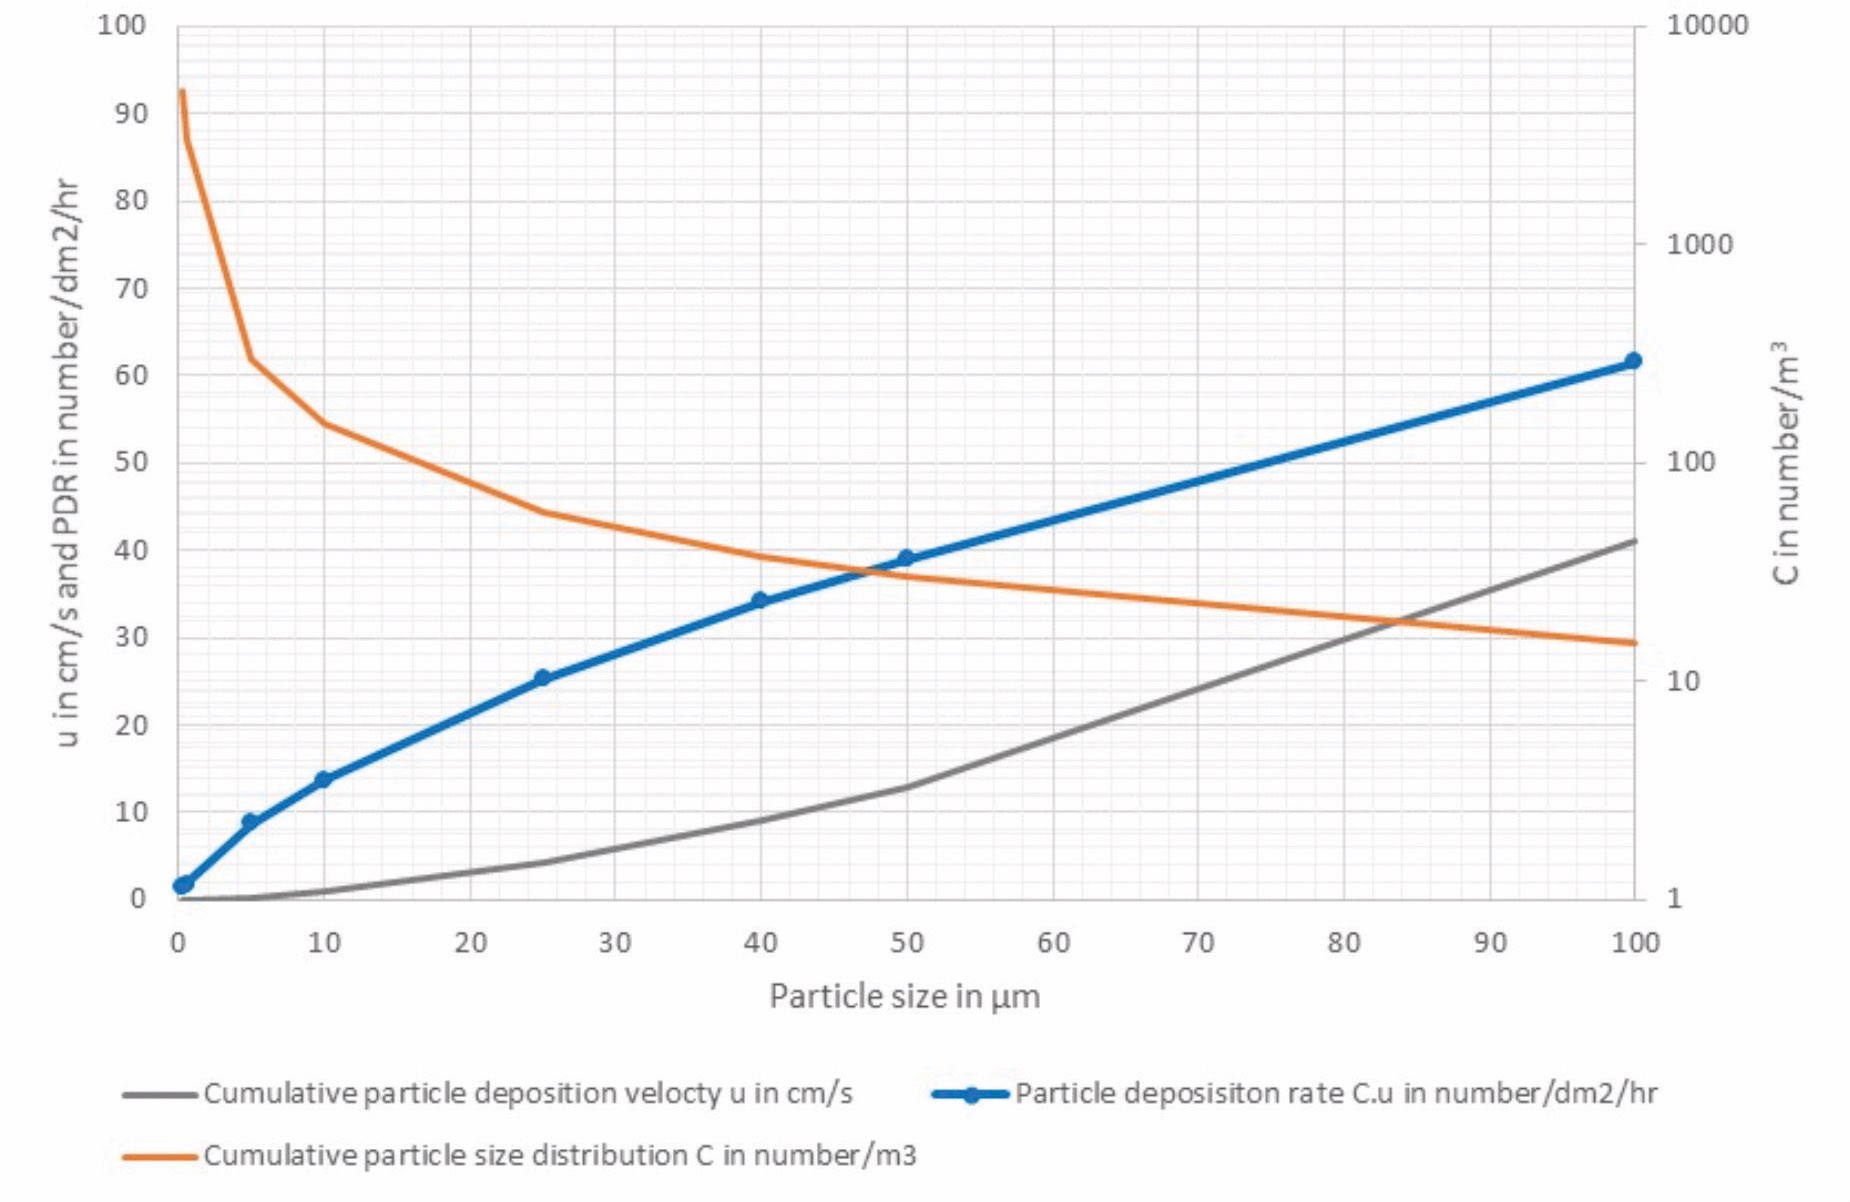
Relationship between airborne concentration and particle deposition rate
When particles deposit on an exposed surface, the concentration of particles (Cs) will increase leading to the following formula:
Cs = PDR x time of exposure t or PDR = Cs / t
This relation is used to measure the particle deposition rate for macroparticles by the use of witness plates or with instruments for particle deposition rate monitoring. These measurement methods are described in ISO 14644-3:2019.
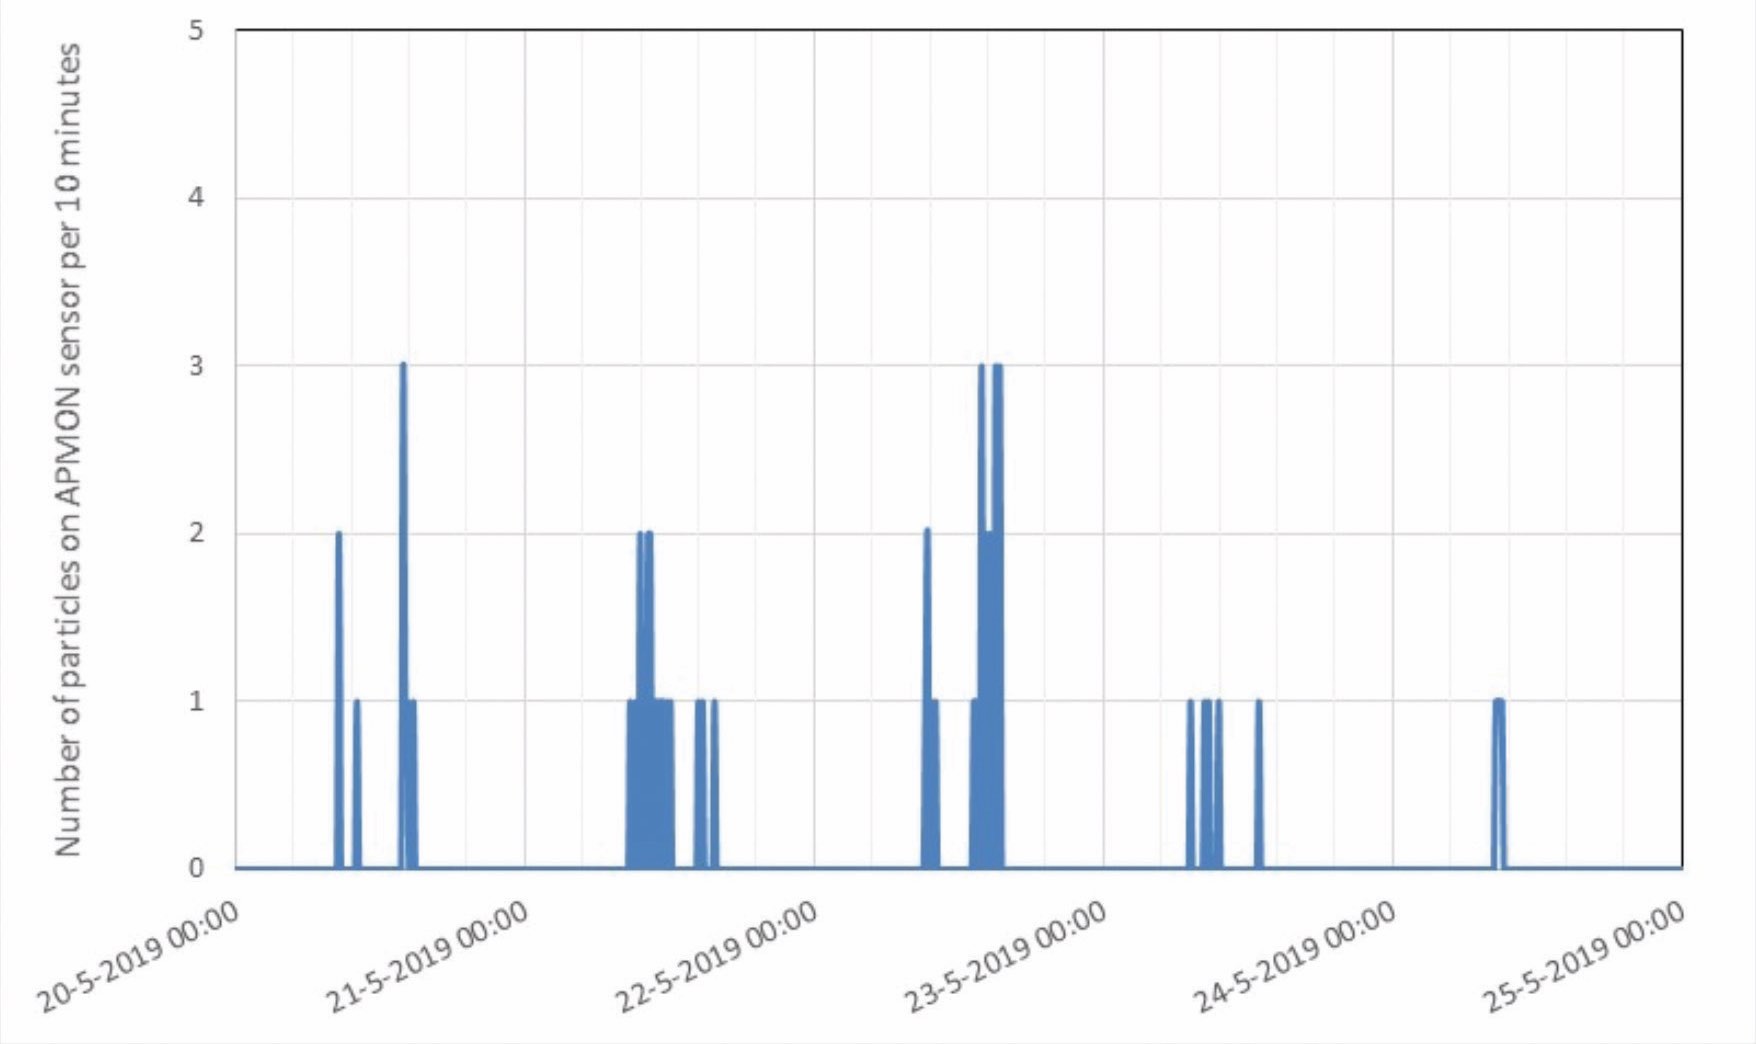
In optical systems for the aerospace industry, for example, the number of particles and the area covered by macroparticles is important. In this case, the particle area is taken instead of the particle size. Figure 4 on the next page shows an example of real-time particle deposition monitoring.
Real-time particle deposition measurements
The surface cleanliness is described in ISO 14644-9:2012. The reference particle size of this standard is 1 µm, and it uses a particle size distribution where the number is proportional to the particle size. Thus, the surface cleanliness level (SCL) is expressed as the cumulative particle concentration times observed particle size D –particle sizes expressed in D µm are the largest size of a particle as measured under a microscope (i.e. Feret diameter)– and it is expressed as Cs = SCL/D. This approach is used in the VCCN –the Dutch abbreviation for the Netherlands Contamination Control Association– guideline on particle deposition. This document is used as the starting point for the development of the draft international standard (DIS)14644-17. Because the TC209 WG 14 had the task to look at macroparticles, 10 µm is selected as the reference particle size.
The particle deposition rate level (PDRL) is the particle deposition rate (cumulative number of particles per sqm per hour) times the observed particle size D divided by 10, and expressed as:
PDRL = PDR.D/10.
In (DIS) 14644-17, PDR levels are given as a factor of ten (i.e. PDRL = 1, 10 up to 100,000). The draft standard provides a table for the maximum PDR per sqm/hr, and PDRL is shown for particles ≥ 5, 10, 20, 50, 200 and 500 µm.
Air cleanliness and particle deposition rate
The ventilation system of a cleanroom determines the removal efficiency of airborne particles. The removal efficiency of larger particles can be calculated by combining the ventilation efficiency with the cumulative particle deposition velocity.
Using the calculation method described by Whyte and Agricola (CARC 35 2018) the particle removal in a three-metre-high cleanroom was calculated and plotted in a graph. Figure 5 on the next page shows that particles that cannot be removed by airflow will deposit on surfaces inside the cleanroom. They can only be removed by cleaning.
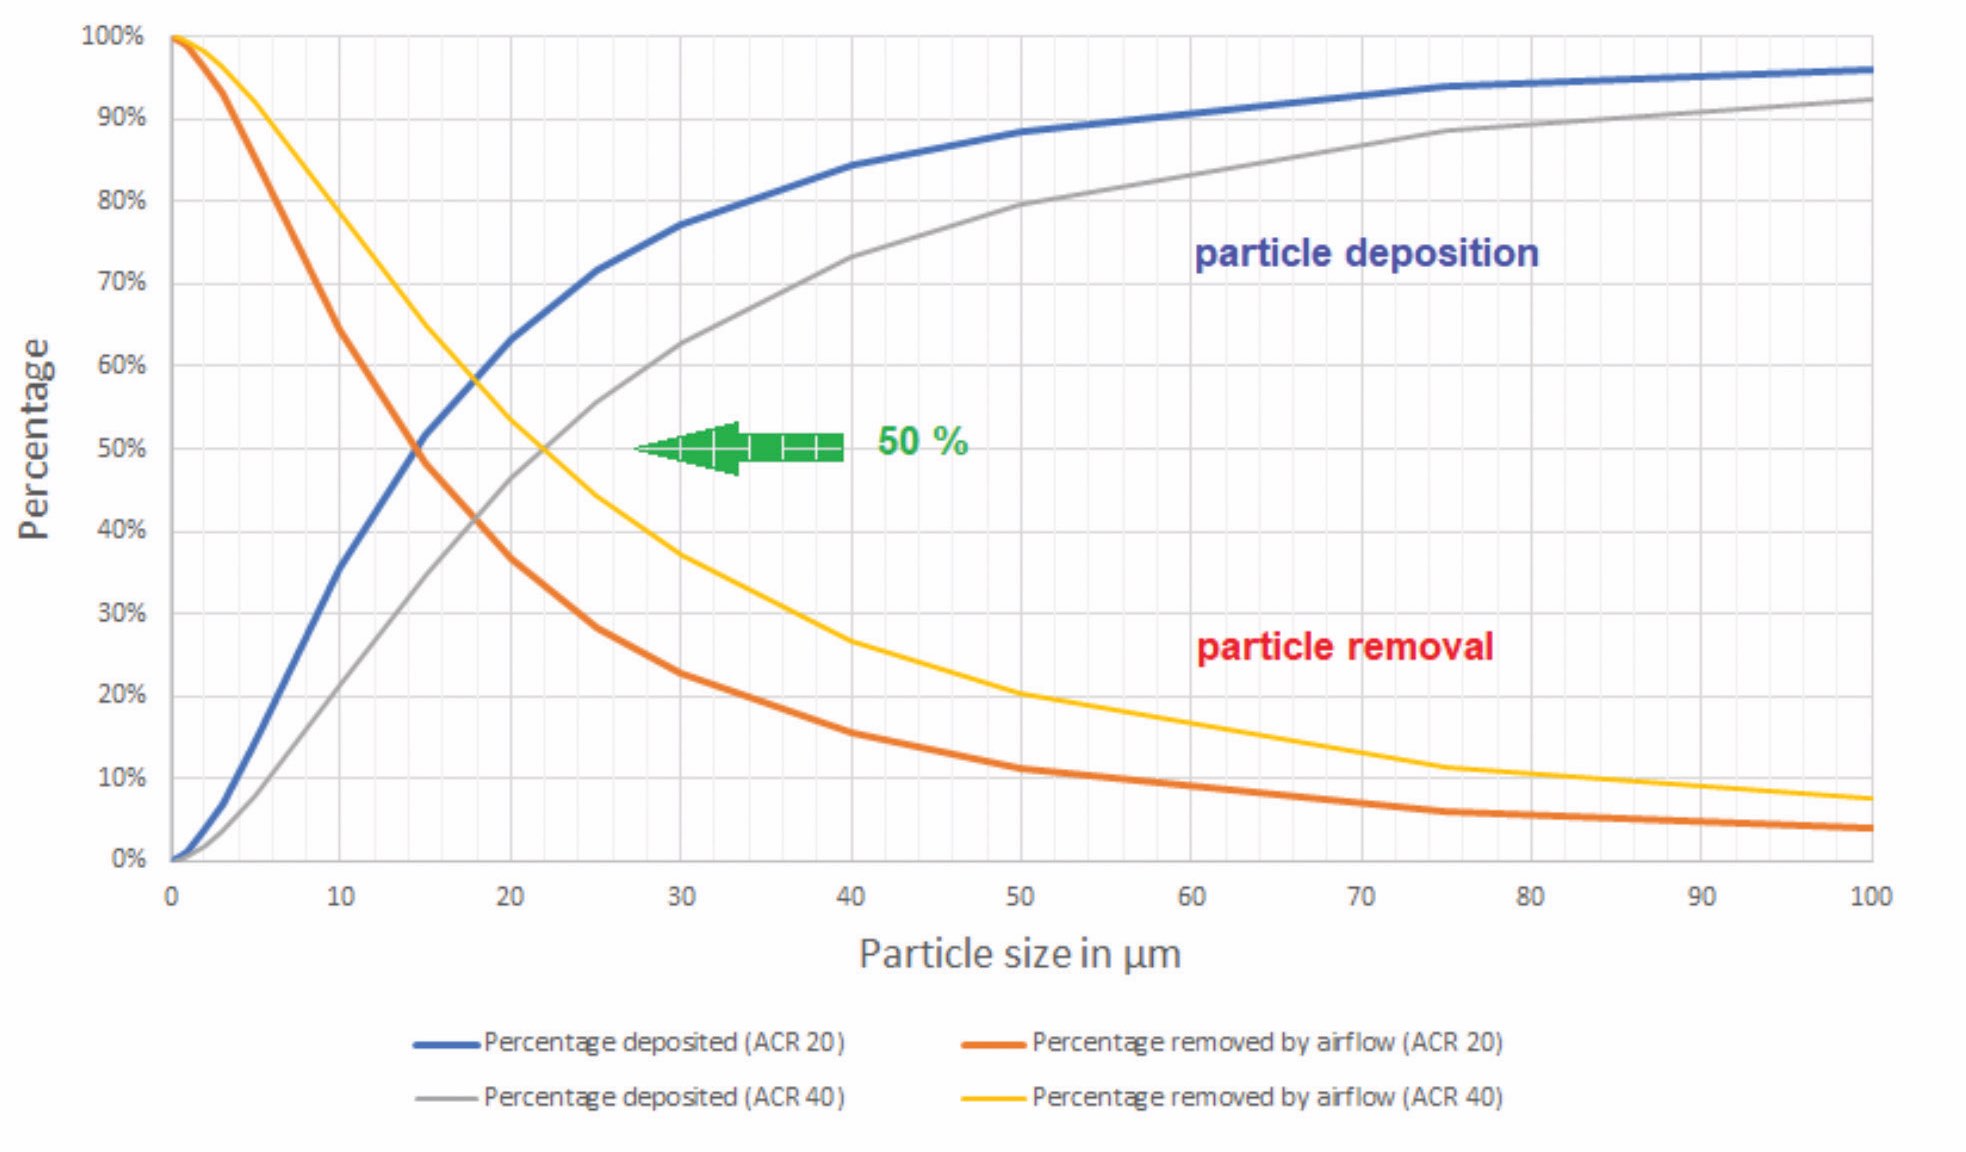
The percentage of particles removed by airflow and the resulting particle deposition
If the air supply rate is doubled, which would take four times more energy, the particle size at which 50% is removed by airflow moves from 15 µm to 22 µm. Thus, by increasing the air supply rate, the removal of macroparticles improves.
However, by improving the operational procedures in a cleanroom, the introduction of macroparticles can be reduced and the removal of deposited particles can be improved, and consequently, the need for an increase of air supply is reduced. But, it is recommended to monitor the particle deposition rate to check the effectiveness of the operational procedures.
It is recommended to monitor the particle deposition rate to check the effectiveness of the operational procedures
In an ISO Class 5 cleanroom, the deposition of the 80 cfu/sqm/hr. If the concentration of particles is ≥ 5 µm/cubic metre in a three-metre-high cleanroom is less than 30 and the air supply creates 40 ACH, then the air volume is 120 cubic metre per sqm. This concentration means that 120 x 30 = 3,600 particles ≥ 5 µm per sqm per hour in the air.
According to figure 5, the deposition rate is 10%, which is 360 particles ≥ 5 µm per sqm per hour. If the deposition is 80 cfu, the ratio between microorganisms in cfu and particles ≥ 5 µm is 0.2. This ratio will increase for larger particles and will be almost one for particles larger than 100 µm.
If the relationship between macroparticles and microorganisms in a particular cleanroom is known, then monitoring the air cleanliness and particle deposition rate of macroparticles will enable operators to provide rapid real-time information on the concentration and deposition rate of microorganisms within that specific cleanroom.
Application of particle deposition rate
The PDRL gives a direct link between the air cleanliness and the likelihood of product contamination by particles. Particles can carry microorganisms and the ratio of cfu:particle increases with particle size, and in many applications, the severity (S) of consequences of contamination increases with particle size.
The likelihood of product contamination is determined directly by particle deposition onto the product and indirectly by deposition on contact surfaces (equipment, tools, workbenches) during exposure. Thus, the risk of contamination depends on the severity times the probability of contamination by particle deposition rate, critical area (A), and time of exposure (t), and it is expressed as Risk = S.PDR.A.t.
The PDRL determines the required air cleanliness for particles larger than 5 µm
In a risk assessment, the vulnerability of a product surface at a critical location can be quantified by surface cleanliness. The value between accepted and unaccepted surface contamination determines the max PDRL.
The PDRL determines the required air cleanliness for particles larger than 5 µm and the operational procedures to control air cleanliness for particles that cannot be removed by airflow. The particle size distribution of these depends on the quality of the operational procedures in a cleanroom. The way the cleanroom is used, the behaviour of personnel and the surface cleaning programme determine the deposition, re-deposition and removal of macroparticles.
The particle size distribution at a monitored location in the cleanroom provides information on ventilation efficiency, the impact of cleanroom discipline and the effectiveness of the cleaning programme, as shown on Figure 6 from data collected in the observed cleanroom.
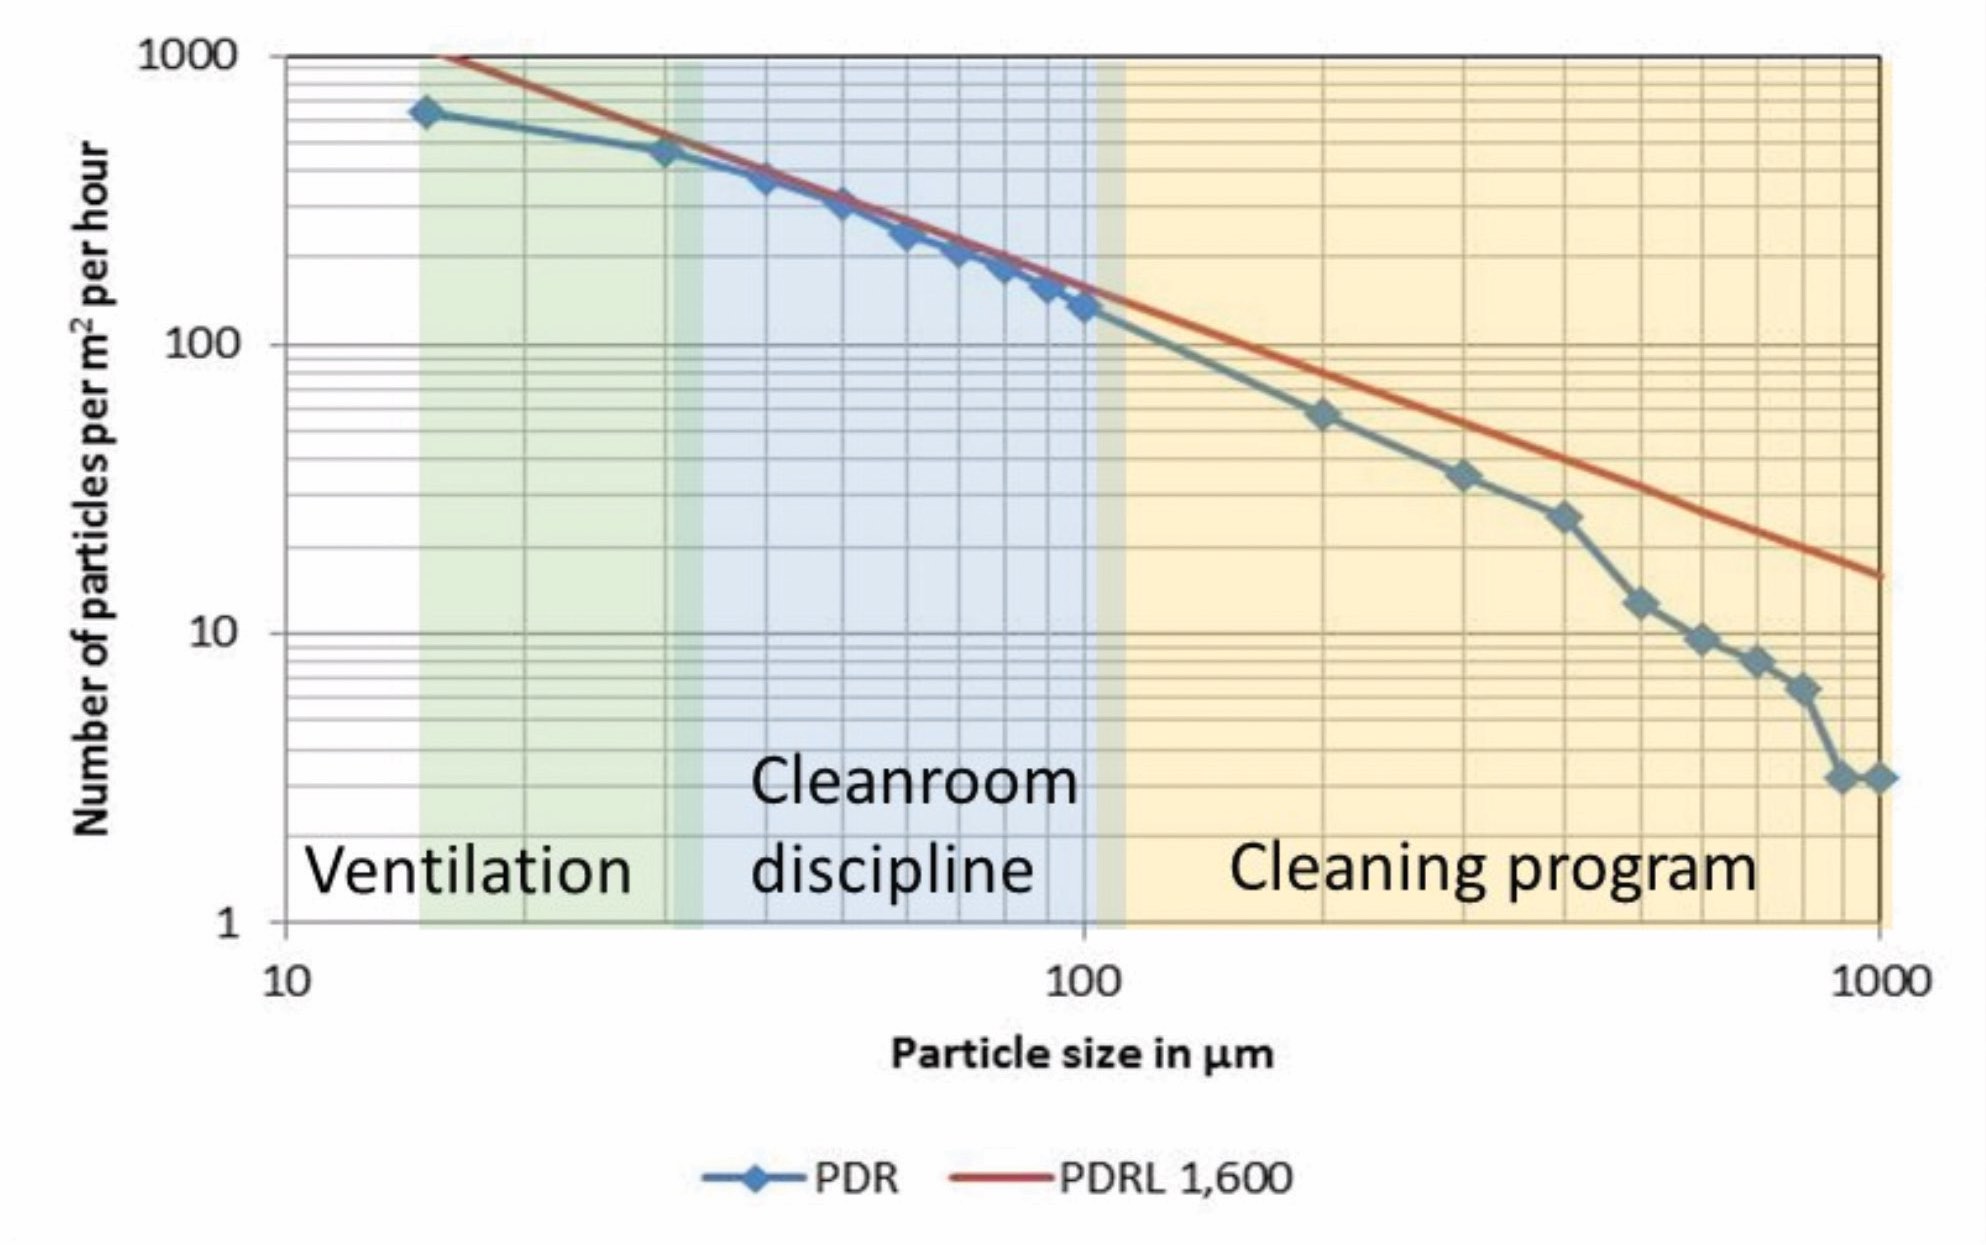
Result of particle deposition rate measurement and aspects of influence
Particle deposition rate provides a direct relation between air cleanliness and product contamination and can be used in a risk assessment to determine the required clean controlled environment and operational procedures.
When established, particle deposition rate monitoring can be used to monitor the effectiveness of the established control, and particle size distribution data can be used to determine what to improve, if necessary.
Draft ISO 14644-17
Although a DIS on particle deposition application is submitted for voting by the participating (24) and observing member countries (21) of the ISO TC 209, not everybody is convinced of the need of this standard yet.
People who do not have experience with PDRL monitoring do not understand the power of this parameter that relates air cleanliness directly to the probability of surface contamination. However, it demonstrates the result of the established cleanroom installation and operational procedures.
N.B. This article is featured in the September 2019 issue of Cleanroom Technology. Subscribe today and get your print copy!
The latest digital edition is available online.