Study into human particle shedding

Published: 27-Jul-2011

Humans are the main contamination risk in cleanrooms, particularly through the shedding of particles from personal clothing, exacerbated by movement. Even when specific cleanroom garments are worn, particle measurements show that undergarments can still be a major source of bioburden

You need to be a subscriber to read this article.
Click here to find out more.

A critical addition to cleanroom bioburden comes from people, but how many particles and how that changes when they are still or moving has been little studied. Dastex set up a testing strategy to find out.

When discussing the subject of people as a source of cleanroom contamination, the main focus of attention is “how many particles on average does a person give off per minute?” Very often, in this context, the work of Austin1 is considered. Unfortunately, there are no new studies available on this subject, not even on the question of how particle values compare for employees wearing a cleanroom coat with those for employees wearing a coverall.

To address this lack of data, Dastex set about carrying out a comprehensive study on this subject using the following procedure.

Experimental methodology

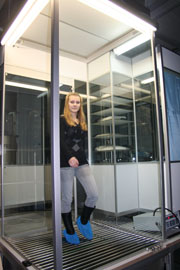
The measurement set-up was as follows: A body-testing box was set up on company premises and this provided the basis for the technique of measurement. The principle of measurement process within a body box is described in a guidance note from the IEST.2 A defined cleanroom (with an area of 1.20m by 1.20m) is completely covered with a fan filter unit (FFU) using an H13 filter, while the floor construction is chosen such that the air can be led into the air return shaft with as little turbulence as possible.

Figure 2: Test subject in walking simulation with cleanroom coat and suitable equipment

Figure 2: Test subject in walking simulation with cleanroom coat and suitable equipment

The body box itself is kept at a constant temperature and air humidity adjusted to the air speed (air change) of the appropriate series of measurements and to the level of cleanliness when idle (i.e. without anyone in the box).

With regular air processing in the body box, a cleanroom class of ISO 4 (according ISO 14644-1) can be sustained without problems when no one is in the room. When a person enters the body box, it can be presumed that almost all particles registered by measurement techniques are from them. These particles are counted in the exhaust air at defined measuring points.

Of course, when evaluating this data, the test volume flow must be considered in relation to the whole volume flow. More clean air is supplied to the test box via the FFU than can be processed through the measuring probes placed in the exhaust air. Consequently, measured values must be multiplied by a factor dependent on the air speed, and adjusted in each case.

Furthermore, with such measurements other factors must be taken into account. For example, people do not give off particles evenly during a day. Also a person’s own clothing worn under the gowns can vary in its particle release. Movement intensity during the investigation also has an influence.

Therefore, for comparative studies, it is important to keep many of these influencing factors as steady as possible, or to define them accordingly in the approach. On the basis of several years of experience with this test cabin, it was possible for Dastex to limit accordingly the most important factors.

Shedding from personal clothing

Figure 3: Test subject in standing simulation with cleanroom coverall, hood, boots and suitable equipment

Figure 3: Test subject in standing simulation with cleanroom coverall, hood, boots and suitable equipment

The first series of measurements deals with the question of: how many particles does a person shed during movement without cleanroom garments? For this series of measurements, the test subjects wore their normal personal clothing. Several (more than 10) people put themselves at the company’s disposal for these measurements. When analysing the series of measurements, sex, age and size were not differentiated.

For the first study, the test was limited to 20 minutes. During this time the devised “movement programme” consisted of two different conditions to be tested: walking on the spot and standing still, each in a time-fixed rhythm. During the study, extreme or fast movements were deliberately avoided because they generally do not, or should not, occur in daily cleanroom operation.

From the accumulated measured values, average values were calculated and projected with the corresponding multiplication factor (in relation of the aerial volume supplied by FFU to the test volume of the particle counters). The results (according to particle size) are indicated in Table 1.

Table 1: Number of particles shed per minute by test subjects in personal clothing
Test personSexAv. number of particles/ minuteAv. number of particles/ minuteAv. number of particles/ minuteAv. number of particles/ minute
standingwalkingstandingwalking
m/f≥ 0.5µm≥ 0.5µm≥ 5µm≥ 5µm
1m2684.650361
2f651.460249
3m1844.3985100
4f1132.179852
5f1822.2871867
6f3465.5477112
7m40413.36710316
8f1893.895135
9m1542.626576
10f58798633
11f53657630
12f131.998092
13m3374.78432209
Average on all measurements1823.742895
Actual numbers of particles (projected)86,0071,768,3463,78144,785

An interesting aspect was the single measured values of certain test subjects. With these it could be proved that the personal clothing can have an extraordinary influence on the amount of particles shed by a person (see Table 2). The measured values for the same person could vary by a factor of eight or more, depending on the type of personal clothing they wore.

This knowledge led to the decision to define the clothes worn under the cleanroom garments in further studies to standardise conditions.

Table 2: Particles ≥ 0.5µm shed per minute by one test subject in different personal clothes
Test person
Sex
Av. number
of particles/ minute
Av. number
of particles/ minute
Single measure-
ments
Single measure-
ments
standingwalkingstandingwalking
m/f≥ 0.5µm≥ 0.5µm≥ 5µm≥ 5µm
1m2684,6502192,615
51810,133
671,202
Actual numbers
of particles
(projected)
126,6482,197,437103,4921,235,763
244,7904,788,521
31,662568,026

Particle shedding in cleanroom garments for class ISO 7 to 9

To provide uniform “interim” clothes, tracksuits made of 100% cotton (same cut, same age and washed several times) were chosen. In this case, cotton clothes were deliberately chosen because this kind of clothing is worn under the cleanroom garments and cotton produces sufficient particles to enable them to be measured.

Tests quickly showed that the people with the tracksuits shed more particles than with their personal clothing. This may be explained by the high proportion of synthetic fibres used in personal clothing which, therefore, generated less wear. Thus the second testing phase had to be modified slightly.

In the second phase, people wore the defined tracksuit, defined cleanroom shoes, a disposable fleece head cover and a cleanroom coat (ASTM-A), freshly decontaminated and made of first-class cleanroom fabrics, as usually worn in cleanroom classes ISO 7–9 (according to ISO 14644-1).

The original movement programme should have also been followed as with the normal personal clothing. But because all test subjects with cleanroom coats shed more particles than in personal clothing and the cause for this was readily identified – the cotton tracksuit – the phase two sequence was changed.

First the test subjects entered the body box with cotton tracksuits and the cleanroom shoes and repeated the defined movement programme for 10min. After that they left the body box and put on the cleanroom coat as well as the disposable fleece head cover. Two minutes later they re-entered the body box and the subjects could move freely for three minutes (to acclimatise with cleanroom garment). They then followed the same movement programme as in the first test phase (standing and walking). The results of phase 2 are summarised in Table 3 (note: two test subjects were not available for the second phase).

Table 3: Particles shed/min for test subjects in cotton tracksuits and subjects in cotton tracksuits with cleanroom coats on top
cotton tracksuit
coat (over it)
Test-
person
SexAv. number of particles per
person
Av. number of particles per person Av. number of particles per person Av. number of particles per person
standingwalkingstandingwalkingstandingwalkingstandingwalking
m/f≥0.5µm≥0.5µm≥5µm≥5µm≥0.5µm≥0.5µm≥5µm≥5µm
1m76436,986 177112034,883483
2f
not recorded
151959214,9039220
3m
not recorded
264504737,2916108
4f48788,590411.1704478,4398145
5f1,23046,257305351664,938478
6m1,836111,50045381,55836,28638551
7m2,97227,836605543184,673783
8f1,322109,177241,7041,83520,66241419
9f8,388126,3661461,7801,01912,17220 196
10f
not recorded
252358215,914 8252
11m1,01674,983281,51152916,60012300
Av. on all measure-
ments
2,25277,7124081870213,34221214
Actual nos of particles (projected) 1,064,16236,724,06819.032386.430331,742 6,304,946 9,795 101,172
ca. 31.2% from base levelca.
17.2%
from
base
level
ca. 26.2% from base levelca. 51.2% from base level

Particle shed in cleanroom garments for class ISO 5 to 6

In the third phase, the test subjects wore the cotton tracksuit again, along with a cleanroom tracksuit, a cleanroom full cover hood, cleanroom knee-length boots, nitrile gloves and a disposable 3-coat facemask. This garment arrangement is often used in cleanroom classes ISO 5 and 6 (according to ISO 14644-1). The phase sequence, above all the movement programme, remained unchanged.

As a precaution, control measurements were carried out also during this study with cotton tracksuits only. However, to change the test, the subjects spent 8min in the box. The results of this series of tests are summarised in Table 4 (for the third phase 10 test subjects were available).

Table 4: Particles/min shed when wearing cotton tracksuits and when wearing cotton tracksuit with coverall and knee-high boots on top
cotton tracksuit
coverall + cap + boots (over tracksuits)
Test-
person
SexAv. number of particles per
person
Av. number of particles per person Av. number of particles per person Av. number of particles per person
standingwalkingstandingwalkingstandingwalkingstandingwalking
m/f≥0.5µm≥0.5µm≥5µm≥5µm≥0.5µm≥0.5µm≥5µm≥5µm
1m1,4729,0802914456720.30.4
2f144165,05012,1141203761.23.1
3m41425,460865432142 0.20.5
4f75115,69081,405582561.02.8
5f7851,4701661451990.21.3
6f2,81082,940411,182673520.70.4
7f3,47039,26277619201160.50.7
8f755145,310141,729371180.61.6
9m3,74047,3901191,2591124771.56.6
10m89368,920241,043591400.40.7
Av. on all measure-
ments
1,38575,057321,081612250.71.8
Actual nos of particles (projected) 654,50535,469,46015,122510,84528,827106,328331.0851.0
ca.
4.4%
from
base
level
ca.
0.3%
from
base
level
ca.
2.2%
from
base
level
ca.
0.2%
from
base
level

If the cotton tracksuit (under the cleanroom coverall) was substituted with “interim” clothing adapted for cleanrooms (based on 100% of synthetic fibres), one has the typical clothing for application in cleanroom classes ISO 4 and 5 (according to ISO 14644-1) or for aseptic areas.

Reports of similar studies that are designed to define the efficiency of under clothing adapted for cleanrooms already exist. For example, a study at ITV-Denkendorf proved, among other things, that by means of undergarments suited for cleanrooms, the number of particles and germs shed could be reduced by about 50% or more – figures are also given for direct comparison with under garments consisting of a cotton tracksuit.3

In conclusion, the Dastex study showed the impressive fluctuation in contamination from people wearing undefined clothing, which operators of cleanrooms must take into account. On the other hand, these extensive investigations also showed that, by means of an adjusted cleanroom garment system, this contamination risk can be minimised (see Table 5 and graph).

Table 5: Particles shed/min with different garment systems and depending on movement
standingwalkingstandingwalkingstandingwalking
Garment≥0.5µm≥0.5µm≥1µm≥1µm≥5µm≥5µm
Cotton tracksuit873,30434,955,780657,31225,114,78017,077448,638
Coat331,7426,304,946130,9012,506,4959,795101,172
Coverall28,827106,32810,39632,135331851
Number of particles ≥ 0.5µm shed/min by test subjects in different garment systems in two different modes of movement

Number of particles ≥ 0.5µm shed/min by test subjects in different garment systems in two different modes of movement

References

1. P. R. Austin: Design and Operation of Clean Rooms, Troy, Michigan, Business News Publishing Company, 1970

2. IEST-RP-CC003.3: Garment System Considerations for Cleanrooms and Other Controlled Environments. Institute of Environmental Sciences, USA, Recommended Practice

3. C. Moschner: Cleanroom Undergarments, Cleanroom Technology September 2002

Footnote

This article first appeared in the German language publication ReinRaum Technik, Vol. 12, No. 2, published by GIT Verlag

You may also like