All manufacturing sectors are facing major challenges in the current climate: legislation is getting stricter, compliance increasingly expensive and international standards get ever more complex.
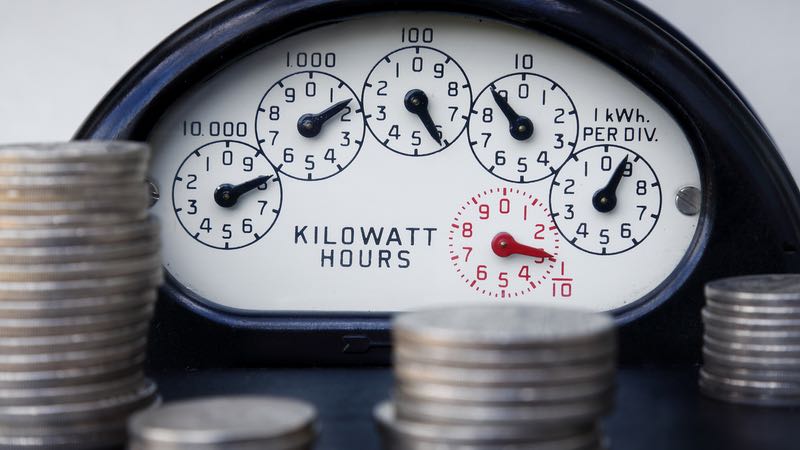
Energy use, a key parameter for cleanroom operators to factor, has seen new regulation and standards coming into play as governments look to curb CO2 emissions and energy wastage. The BS EN 16001, unveiled at the BSI Cleanroom Conference 2010, is the energy management standard that demands a greener ethos and yet puts commercial performance on the front line.
The BS EN 16001 is designed to ensure that systems are in place for continuous improvement in energy management. It guides cleanroom users to look at how they manage their energy usage and provides commercial benefits in terms of reduction in operational costs.
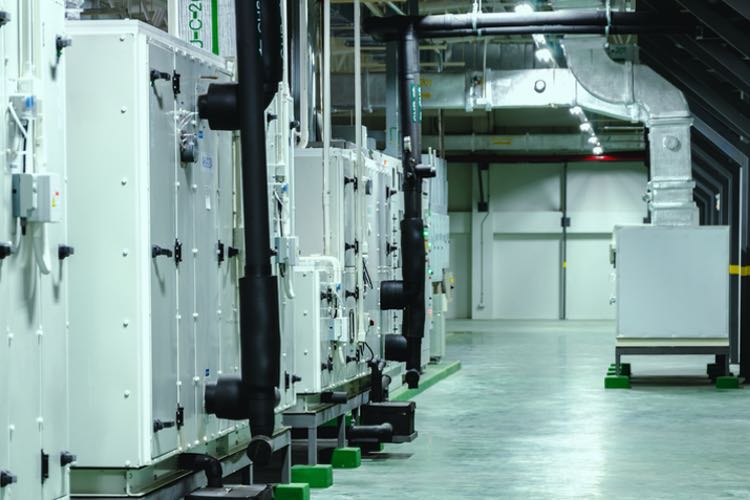
The cleanroom sector places a heavy requirement on HVAC; air handling units are frequently running 24/7. The wide use of HEPA filters and the need to control humidity and temperature also notch up energy consumption.
In the pharmaceutical and medical sectors energy-expensive processes have become enshrined in the standards and are rigorously enforced. However, what is the ‘science’ behind these cleanroom design benchmarks that have such an influence on the present day operational ‘norms’?
The development of cleanrooms in the past 50 years shows that many of the key pharma HVAC control parameters have their origins in the cleanroom technology of the 1960s developed for the electronics industry; in particular, the evolution of cleanrooms as a result of NASA’s space travel programme in the 1950s and 1960s.
It is generally accepted that during this period the now familiar term laminar flow was introduced, as well as the specification of 0.46 m/s air velocity and the requirement for 20 air changes per hour. These concepts appear in cleanroom guidelines, regardless of their relevance or effectiveness in different industry sectors.
Airflow and contamination control
There is a reasonable motive to challenge current contamination control recommendations without affecting operational effectiveness. Some parameters can be relaxed by using a risk-based approach to gather the required data to show there is no risk to product yield or safety. For example, what would the impact to the clean environment be if air velocity was reduced from 0.46 m/s to 0.30 m/s? The rule of thumb is as follows:
- Grade A and B: 45 air changes/hour
- Grade C: 30 air changes/hour
- Grade D: 20 air changes/hour
All of that air needs to be conditioned, moved and filtered 24/7 and therefore energy consumption is a significant ongoing cost. How are these air change rates arrived at in terms of mitigating the risk of airborne contamination? They are not based on calculated suppression rates but based on historical fact that using those high air change rates will result in exceeding the cleanroom grade classification. Documented research by Whyte et al. on unidirectional airflow (UDF) areas at the Orthopaedic Unit at Glasgow University has shown that after a certain point increasing velocities did not achieve lower contamination levels.
is it proven that contamination levels will increase with lower air velocities and air change rates
There does not appear to be any published research exploring the net effect on contamination levels as a result of decreasing velocities and volumes. But, is it proven that contamination levels will increase with lower air velocities and air change rates?
Air movement within the cleanroom is fundamental in determining the optimum air velocities and visualisation experiments involving smoke tests are key to understanding this. Airflow visualisation is typically performed once the facility has been fully completed and set into the effective mode of operation. The results of airflow visualisation are reviewed to ensure a minimum sweep of air is achieved within the facility. Often the actual operational characteristics of the facility are far in excess of the minimum sweep expectations.
Airflow visualisation can lead to energy savings when adjustments to the facility HVAC system can be made, selecting a lower air volume flow rate that satisfies the minimum clean air sweep expectations. Computational fluid dynamic simulations can also be used to assess the suitability of clean air sweep patterns at certain predetermined air volume flow rates.
Opportunities for energy savings can also be found in the “out of hours set back” a strategy regularly used in office environments. Here, air changes are reduced in facilities, or unused parts of the facility, overnight or at weekends. The proviso being that airflow must remain high enough to maintain the correct pressure cascade and validated operational status must be resumed before activities recommenced. These actions are easier to achieve when considered at the design stage of a new facility, rather than retrospectively.
Financial Incentive
The UK introduced the mandatory Carbon Reduction Commitment (CRC) Scheme in 2010. Once registered, organisations must monitor their carbon dioxide emissions through energy bills and purchase allowances. The scheme is designed to penalise those companies that do not show a reduction in emissions year-on-year. Companies reduce the number of emission allowances they need to buy if they cut emissions, putting them at a cost advantage to competitors that have not cut emissions.
Opportunities for energy savings can be found in the “out of hours set back” where air changes are reduced overnight or at weekends
Cleanroom operators should consider a CRC Scheme review of current facilities and look for opportunities to reduce energy consumption without the need for wholesale changes or facility redesign, but they will need a benchmark ratio point to gauge improvements and reduce energy consumption, and a comprehensive energy consumption monitoring system to map progress.
The European standard BS EN 16001 was introduced to help companies take a more structured and systematic approach to energy management. Energy monitoring is one of its main focus points and a key clause states: “The organisation shall ... establish the relationship between energy consumption and its associated energy factors and shall at defined intervals, assess actual versus expected energy consumption.” Thus, it requires companies to calculate how much energy they expect to consume and then to monitor how much they actually consume alongside associated energy factors.
While it will require some technical manpower to implement it, the standard is designed to ensure that systems are in place for continuous improvement in energy management, enabling companies to check their energy management performance against benchmarks from within their own company. Already adopted by some European countries, BS EN 16001 will be updated to become ISO 50001.
Action plan
Product safety and yield output have been considered paramount with energy efficiency considerations taking a back seat. But regulations are demanding that companies do more using real-time monitoring records and particle data to persuade the licensing regulatory inspectors that the previous belt and braces approach to the design of cleanroom facilities can be tailored to meet today’s energy management needs without increasing contamination risk.
There is a global need for CO2 reduction and the industry needs to lead the way in tackling this challenge. Companies should be looking at monitoring energy use with suitable methods to benchmark performance year on year.
This article is featured in the October issue. The digital edition is available online.