
Limit breaches provide an early warning system for a potential issue, but are they relied upon too heavily to determine the state of control within a cleanroom? No growth is not a guarantee that the area is under control, and excursions do not always mean that control has been lost. So why is there such a reliance placed on these limits, and how else should environmental control be assessed?
Cleanrooms should be monitored during processing, and also outside of production operations. Monitoring should be performed using principles of risk management to determine the locations and frequency of monitoring required. This rationale should be documented within an environmental monitoring programme. This programme should be set up in all sterile manufacturing environments, documenting the state of control of the facility and assessing the effectiveness of cleaning and aseptic processes. One key factor of the programme is the setting of appropriate action and alert limits.
There are three common approaches for setting alert limits
Action and alert limits should be controlled and specified in standard operating procedures. Action limits are generally set through regulatory guidelines such as Annex 1, the USP or ISO standards, whereas alert levels are specific to the facility and should be set based on the results of performance qualification (PQ) tests and trends in historical data.
Setting action and alert limits
There are several different approaches that can be taken to set alert limits. As long as these are justified in the environmental monitoring plan and the contamination control strategy, it does not matter which method is used. Once each alert limit has been set based on the results of environmental monitoring PQ tests, there should be a procedure in place to track and trend these and re-evaluate the values if necessary.
Three of the most commonly used approaches to setting alert limits are the standard deviation approach, the cut-off value approach, or the non-parametric tolerance limit approach.
The standard deviation approach should only be used where historical data includes high counts, and when data is normally distributed. To calculate these values, a mean and standard deviation should be calculated; alert levels are set at the mean plus 2 standard deviations.
However, data collected from cleanrooms often contain many counts of zero, with a dispersion of counts which are not often normally distributed. Therefore, alternative approaches may also be considered.
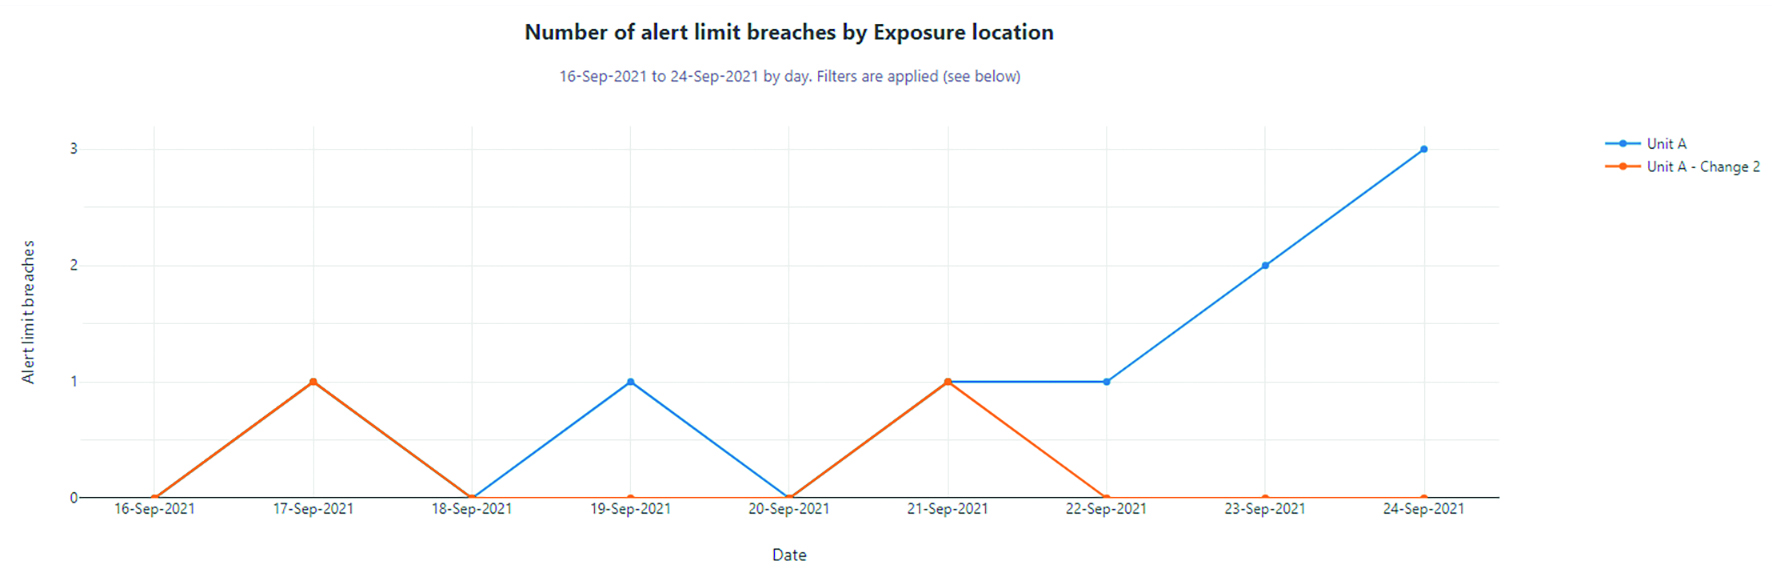
A single breach may indicate an issue, however multiple breaches, may indicate a loss of control
The cut-off value approach takes into account the 95th percentile of historical data and sets the alert limit at this level. The non-parametric tolerance limit approach similarly is used for samples which are not normally distributed. This takes into consideration the 95th percent confidence intervals are used, where 95% of the samples will pass the established alert limit.
No matter which method is used, it should be set following a PQ and then based on historical data following reviews.
Trending
Environmental monitoring data should be analysed regularly to assess whether any trends can be identified in the data. Routine review of environmental monitoring data provides confidence in the control of a facility and allows rapid identification of any adverse trends which may be forming. A trend may indicate a potential problem with the environmental control systems in place within a facility. A single breach may indicate an issue at the time, however multiple breaches, or trends, may indicate a loss of control which must be addressed.
According to the 2020 draft of Annex 1: “Trends can include but are not limited to; Increasing numbers of action or alert limit breaches; Consecutive breaches or alert limits; Regular but isolated breaches of limits that may have a common cause, for example single excursions that always follow planned preventative maintenance” or “Changes in microbial flora type and numbers and predominance of specific organisms.” Individual facilities should set rules for trending, and if these rules are breached, an out of trend investigation should be performed.
It is therefore important to perform regular analysis of all data to ensure that any trends are highlighted and investigated where applicable. Trend analysis is often difficult, especially when large volumes of data are being produced. One of the easiest ways to analyse trends is to look at a graph – if limit breaches or contamination rates on the graph are rising, then there is potentially an adverse trend forming. However, this does not always provide information on “regular but isolated breaches” or “changes in microbial flora type and numbers”. These generally require manual analysis of the data, and these can easily be missed when examining lots of data.
Rates of excursions provide limited information
Trends should also be assessed if a limit breach occurs. Data leading up to the excursion should be assessed to identify whether the breach occurred as part of an adverse trend or was a one-off occurrence which may not indicate a loss of control. Other recoveries before the limit breach may indicate an unusual pattern, which may require additional investigation. As part of these investigations, data following the excursion should also be assessed to determine whether these issues were isolated or continual.
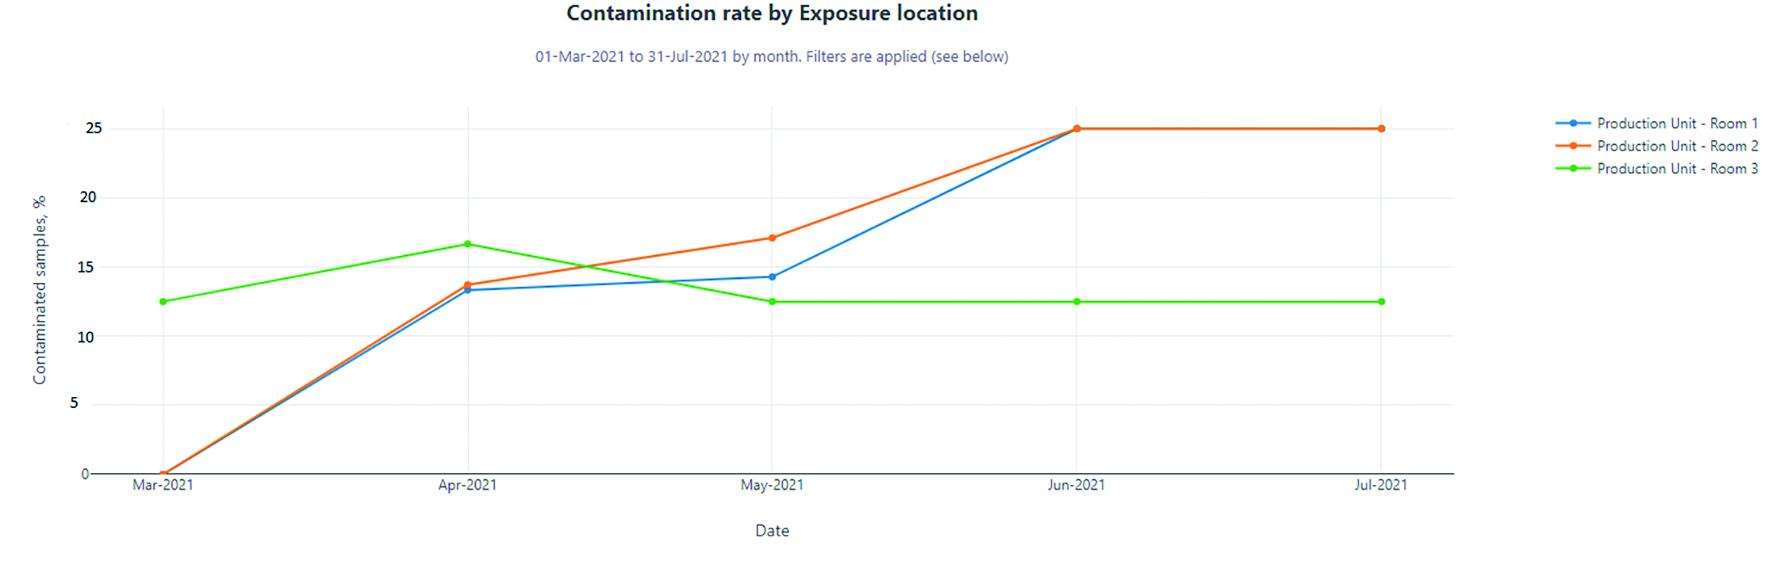
Contamination rates (non-zeros)
Rates of excursions provide limited information about the state of control of an area or facility. They do not consider results from other samples taken within the area, only the limit breached samples. Trending by excursion rate only shows how many samples over a period of time have exceeded limits.
The levels of microorganisms within a population can fluctuate depending on factors such as seasonal variation, new equipment, or personnel fluctuations. These may cause recoveries which don’t exceed alert limits; however, they should be assessed as well to ensure microbial control is maintained.
It is therefore important not only to look at limit breaches when trending, but also contamination rates. These take into account the total number of samples with recoveries across all samples within a given area and provides a more accurate indication of the state of the environment. Contamination rates may detect an area, or an operator, which is not regularly exceeding alert limits, but are consistently recovering lower levels of contamination. This may indicate a loss of control and may require additional CAPA.
An assessment of contamination rates over a period of time, known as a critical recovery rate, should also be used to determine whether there has been a trend. Critical recovery rates are a calculation of the average contamination rate for a duration of time compared to the previous same duration of time.
There are now data storage and analysis tools which can be used to easily analyse data, and some even have trend detection built in. One such example is SmartControl, by Microgenetics, which allows users to set trend rules specific to their facility, and then performs real-time analysis of any data input into the system. Users can then be notified if a breach in limits, or a trend rule is triggered, prompting the relevant investigations. Analysis of contamination rates and critical recovery rates can easily be performed using these tools, replacing the time-consuming effort of reviewing all data manually.
Review of data and limits
Environmental monitoring trend reports should be generated regularly to assess and identify trends in data. These reports should assess any excursions which had occurred and identify any trends in excursion rate or critical recovery rate over a period of time. Any Out of Trend or Out of Specification results should be investigated.
As part of these reports, alert and action limits should be reviewed to confirm that they are appropriate, and these may be altered to reflect changes within the facility. These may require alteration due to process changes or advances in technology. All assessments of excursions and trends, and changes to limits, should be subject to management review, to ensure that appropriate action is being taken and control is being maintained.
Procedures should be in place to define the actions to be taken following limit breaches or trend identification. These will often include the raising of investigations to assess the impact of the event and to determine a root cause. CAPA should be implemented to prevent reoccurrence, and assessment of the return to expected operating parameters should be provided.
Any abnormally high number of recoveries, or significant excursions, should have specific investigations performed to determine whether this incident is an isolated occurrence or can be correlated with other recoveries. An assessment of prior recovery rates should be made to indicate any unusual patterns which may be developing.
Breaching alert and action limits
Breaching an alert limit may not require immediate investigation and corrective action; however, some form of follow-up action is usually required to assess whether the affected area may be involved in part of an adverse trend, and to ensure that the affected area has returned to within normal operating parameters. Subsequent alert limit breaches may indicate a trend, and these would warrant the same investigation as an action limit breach.
If an action limit is breached, immediate investigation should be performed to assess the impact of the excursion, determine a root cause of the excursion, and initiate subsequent CAPA. This investigation may determine that the root cause was laboratory error and there was no true failure. However, if a true failure is identified, further investigation should be performed, with identification of recoveries and review of additional samples all used to attempt to determine the root cause and aid in the assessment of impact. Follow-up monitoring may be performed, and remedial actions such as additional cleaning or retraining may be required. An assessment may also be required for previously filled batches.
Limit breaches provide a rough outline of the cleanliness of the monitoring location and can provide confidence that manufacture has occurred in a clean environment. However, they can only provide a snapshot of information, they cannot provide a full picture of the environment. A single viable sample with no growth does not guarantee control, and conversely, a single excursion does not indicate loss of control.
Therefore, as well as looking at breaches, it is important to supplement these with additional data, such as trending and contamination rates. Analysing this data manually is time-consuming and breaches and trends can easily be missed. Improvements in data analysis technologies such as SmartControl mean that notify users when breaches or adverse trends are triggered, which can ensure that events are immediately and thoroughly investigated, ensuring facilities can remain under environmental control.